A chart earns its place when it answers a business question: where a monthly change came from, which products deserve attention, or which unusual records need investigation. This guide uses a downloadable sample order file to connect inspection, cleaning, calculation, and a useful handoff.
For CSV and Excel attachments that need exploration, start with ChatGPT. For a shared workbook that colleagues keep editing, consider Copilot in Excel, with formulas, PivotTables, and charts that remain part of the spreadsheet.
ChatGPT or Copilot: choose the working environment
| Dimension | ChatGPT | Microsoft 365 Copilot in Excel |
|---|---|---|
| Natural starting point | Upload a file and ask a question | Open an existing workbook and describe the task |
| Strong workflow fit | Ad hoc analysis, file preparation, explaining calculations, exploring charts | Recurring reports, formulas, PivotTables, established Excel collaboration |
| Handoff emphasis | Cleaned files, analysis steps, charts, and written findings | Editable cells, formulas, PivotTables, and charts |
| Your preparation | Clear fields, calculation rules, and export requirements | A well-structured workbook and the appropriate account and license |
| Review focus | Processing steps and exported files | Modified ranges, formula references, and links to source data |
These are editorial workflow recommendations. ChatGPT's documentation describes uploaded-file analysis and chart creation; Copilot works with Excel's own tables, formulas, PivotTables, and charts. ChatGPT data analysis · Get started with Copilot in Excel
How to use each tool well
01 / ChatGPT: move from an open question to a repeatable analysis
ChatGPT can inspect XLS, XLSX, and CSV files, create tables and charts, and explain code-backed analysis. A structured file with clear columns is the useful starting point when exact values matter. Official data analysis guide
It fits the moment when you have a file and need to work out which questions to ask. Begin with fields, missing values, and duplicate records. Then investigate monthly changes, unusual orders, or product groups. Keeping each exchange focused makes the underlying assumptions easier to see.
A productive sequence: inspect the file, propose a cleaning plan, confirm calculation rules, aggregate, examine exceptions, and export the result. Save the intermediate tables. They make it easier to reuse the process when next month's file arrives.
For recurring tasks, request the cleaning rules, expressions, and a code file alongside the results. A colleague should be able to identify which records were removed, how amounts were calculated, and which summary table produced each chart.
Open ChatGPT · ChatGPT Plus details
02 / Microsoft 365 Copilot: keep the analysis editable inside the workbook
Copilot in Excel supports formulas, tables, PivotTables, charts, sorting, filtering, and formatting. Its current modes include editing, planning, and chat, so you can discuss an approach before applying workbook changes. Microsoft's getting-started guide
This is useful for a team with an existing monthly reporting workbook. Sales updates the orders, operations maintains the summaries, and a manager can still open a formula or edit a chart using familiar Excel features.
A productive first session: create a working copy. Give every column a single, descriptive heading and organize the records into a structured table. Tell Copilot which sheets to preserve and which areas it may change. Ask for separate summary and chart sheets, leaving the original records available for inspection.
A valuable team handoff: editable formulas, clearly named sheets, and instructions for the next refresh. A report becomes more useful when the next person knows how to update it, as well as how to read it.
Copilot plans · Data insight examples
Prices: budget around the people and the workflow
Figures use US website prices in USD. Seat costs are calculated for the people who will use the plan.
| Plan | Listed price | Billing and requirements |
|---|---|---|
| ChatGPT Free | Free | Begin with the file-analysis access available in your account |
| ChatGPT Plus | US$20/month | Monthly billing; API usage is billed separately |
| Microsoft 365 Copilot Business | Standard US$21/user/month paid yearly; the page also displays an US$18 yearly offer | Add to an eligible Microsoft 365 subscription; inspect offer eligibility and terms |
| Microsoft 365 Copilot Business, monthly subscription | US$25.20/user/month | Monthly subscription |
| Microsoft 365 Business Standard with Copilot | US$23.50/user/month paid yearly; US$28.20/user/month on a monthly subscription | A listed bundle combining office applications and Copilot |
Price sources: ChatGPT Plus and Microsoft's pricing page. Check the licenses already assigned to your team: Copilot Chat and the full workbook experience have different entitlements.
Budget example: one person using Plus for file analysis spends US$20 per month. Three Copilot Business seats at the standard annual rate represent US$63 per month, or US$756 per year, for the AI component alongside the underlying office subscriptions. Three new Standard with Copilot bundle seats at the listed annual rate represent US$70.50 per month, or US$846 per year. Compare these with the subscriptions you already own.
Prepare the spreadsheet before asking for insights
Use one record per row and one type of information per column. Dates, product names, quantities, amounts, and statuses deserve separate fields. Keep decorative headings, merged cells, and explanatory notes on a documentation sheet. Retain an original copy and use a working copy for analysis.
The download below contains 12 synthetic order rows created for this guide. It includes a duplicate, a cancellation, refunds, a missing region, and several months. It contains no real customer information.
Download the sample orders CSV · Download the data dictionary
| Field | Meaning | Rule in this exercise |
|---|---|---|
| order_id | Order identifier | Keep one copy of an entirely identical duplicate |
| order_date | Order date | Use this date to assign the month |
| region | Region | Replace an empty value with Unknown and retain the order |
| quantity / unit_price | Units / price per unit | Multiply to calculate merchandise value |
| discount / refund | Order-level discount / refund | Subtract each once per order |
| status | Order status | Include paid and refunded; track cancelled separately |
Exercise formula: quantity × unit_price − discount − refund. This is an order-analysis example that groups amounts by order month. For your own files, first decide the date field, currency, refund period, and tax treatment.
Workflow: CSV to an explainable monthly report
Step 1. Inspect the file
Ask for row count, field names, types, missing values, duplicate identifiers, and date range. Establish what a row represents. Two rows with the same order number may be duplicated exports or separate product lines in one order. The distinction determines how to deduplicate the file.
Step 2. Write down the rules
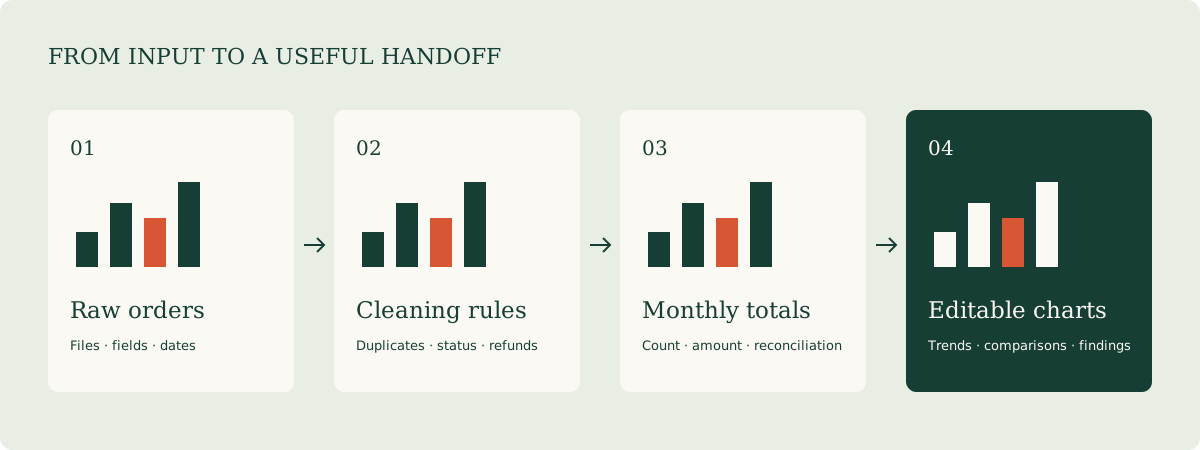
For this exercise, remove one identical duplicate, exclude the cancelled order from the financial total, retain the empty region as Unknown, and subtract the refund amount. Request a cleaning log showing how many rows each rule affected and which order identifiers were involved.
Step 3. Build the table before the chart
Calculate monthly order count, merchandise value, discounts, refunds, and net amount. Check that the monthly net amounts add up to the cleaned detail total. Then build the chart. This sequence helps locate a problem in preparation, calculation, or presentation.
Step 4. Match the chart to the question
Use a line chart to explore change over time, horizontal bars to compare products, and a detail table to investigate exceptions. Give each chart one main question. A title such as “Order net amount, June–August 2026, USD” carries useful context into a presentation or email.
Step 5. Separate observations from investigations
“August net amount differs from July” is an observation. To explore why, split the results by product, region, and order count. Turn the next step into a concrete task, such as reviewing refunds for one product, and identify who will do it.
Step 6. Deliver files someone can update
Export cleaned_orders.csv, monthly_summary.csv, charts, and a short analysis note. In Excel, use Raw, Clean, Summary, Charts, and Readme sheets. Explain where new data should be inserted and which rules deserve another review next month.
Reference result: check your analysis against the sample
The accompanying calculation script generates the following result using the stated rules. Twelve source rows become eleven unique orders after one identical duplicate is removed. One cancelled order is tracked separately, leaving ten orders in the net-amount calculation.
| Month | Included orders | Net amount, USD |
|---|---|---|
| 2026-06 | 3 | 480.00 |
| 2026-07 | 4 | 570.00 |
| 2026-08 | 3 | 550.00 |
| Total | 10 | 1,600.00 |
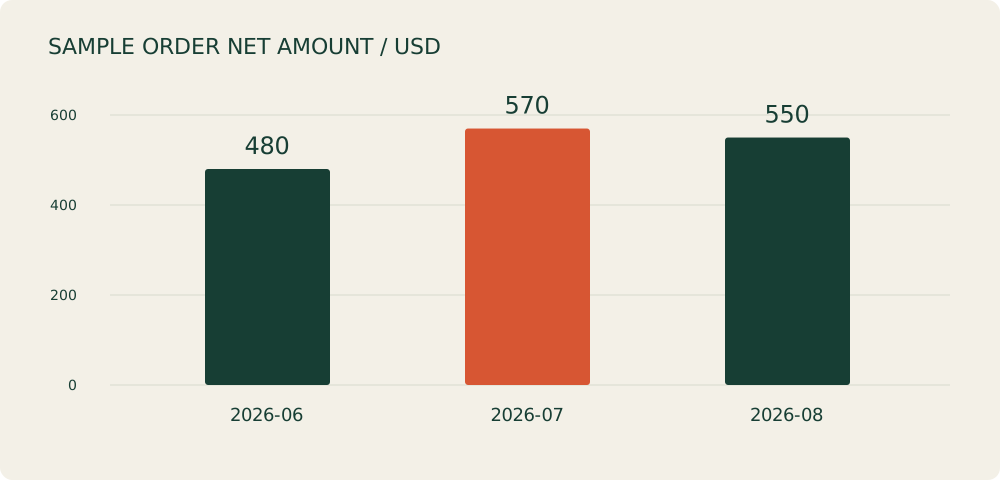
If your results differ, inspect four points first: whether the duplicate was counted twice, whether the cancelled order was included, whether refunds were subtracted, and whether the order-level discount was incorrectly multiplied by quantity.
Download the monthly reference totals
Three prompts to copy and adapt
Inspect the structure after uploading
Inspect the uploaded orders file and produce a data-quality report:
row count, field names and types, date range, missing values,
duplicate order_id values, and entirely identical rows.
Distinguish product lines within one order from duplicate exports.
List affected order identifiers and a proposed action for each issue.
Provide the plan first; wait for me to confirm the calculation rules before cleaning.
Define the monthly calculation precisely
Process the sample file with these rules:
1. Keep one copy of each entirely identical record.
2. Include only orders with status paid or refunded.
3. Net amount = quantity * unit_price - discount - refund.
4. Replace an empty region with Unknown. Group by order_date month.
5. All amounts are USD. Discount and refund are order-level amounts.

Return a cleaning log, cleaned records, monthly totals, and product totals.
Check that the monthly net amounts sum to the detail net total.
Create a monthly net-amount chart and export the CSV files and calculation steps.
Preserve the next update path in Excel
Inspect this workbook and propose which sheets you will read and change.
Preserve the Raw records and create Clean, Summary, Charts, and Readme sheets.
Summary should show monthly order count, merchandise value, discounts, refunds, and net amount.
Use editable charts with a date range and USD units in their titles.
In Readme, document formulas, filters, and next month's replacement and refresh steps.
Let me review the plan before editing. When finished, list the modified ranges.
Make next month's analysis easier
Save the rules agreed in the first exercise: duplicate handling, cancellation states, refund dates, currencies, missing values, metric definitions, and chart purpose. Next month, inspect changes in fields, statuses, and currencies before reusing the process.
When a new exception appears, add it to the documentation. Partial refunds need a clear example. An export that begins adding currency symbols to amount fields needs a conversion step. Over time, the reporting template becomes a compact record of how the business data works.
To explain the results to colleagues in two languages, use the brief and glossary method in the Documents & Translation guide. To turn the reporting discussion into assigned work, continue with the Meetings & Action Items guide.