Finanza
AI Competence
Strumento per analizzare le correlazioni azionarie e studiare le tendenze delle aziende.
Informazioni su questo strumento
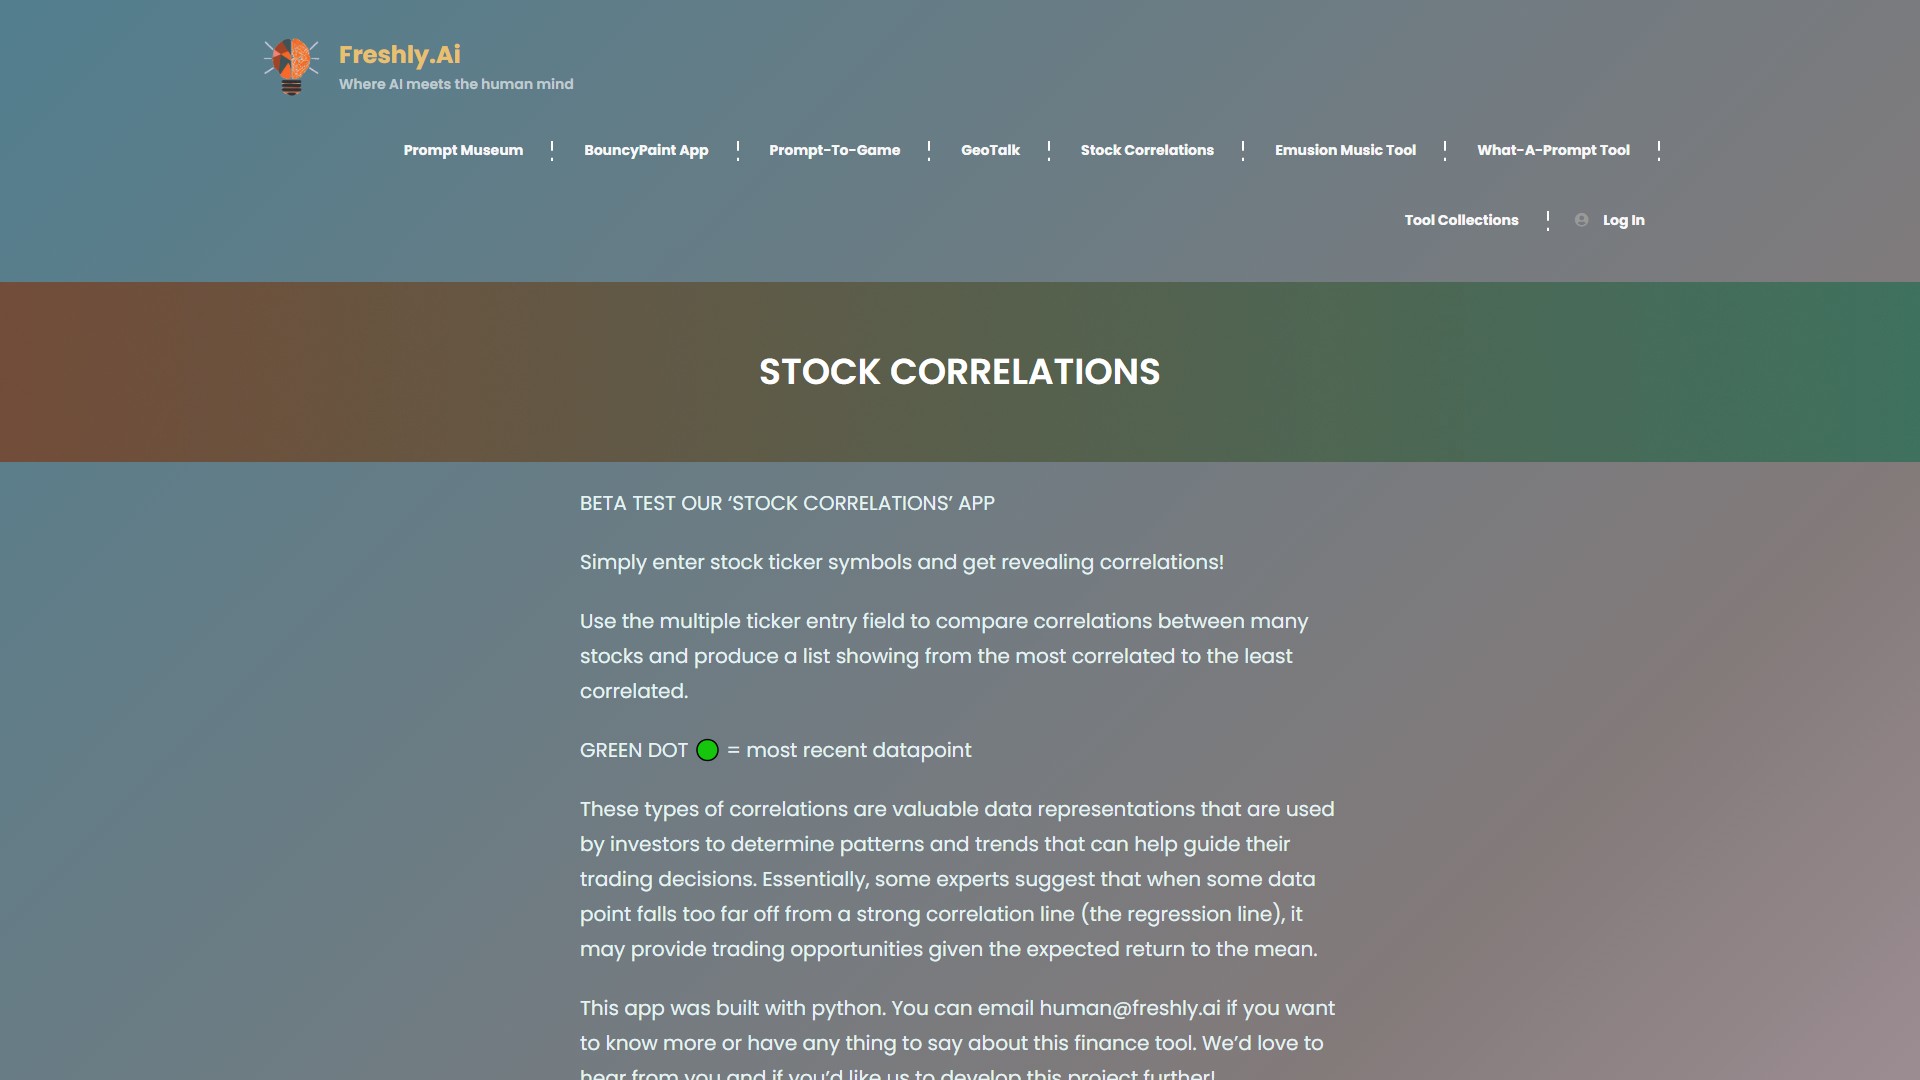
AI Competence è uno strumento per analizzare le correlazioni tra azioni. Inserisci più simboli di borsa per confrontare le correlazioni e ottenere un elenco dalla più alta alla più bassa. Il punto verde indica il dato più recente.
Queste correlazioni possono aiutare gli investitori a individuare schemi e tendenze utili per orientare le decisioni di trading. Secondo alcuni esperti, un punto dati molto distante dalla retta di regressione può indicare opportunità basate sul ritorno atteso verso la media.
L’applicazione è stata sviluppata in Python. Per saperne di più, scrivi a human@freshly.ai. È rivolta a investitori e trader, si trova in fase beta e non indica informazioni sui prezzi.
Analisi del traffico
Segnali di traffico, ranking e coinvolgimento per questo strumento.
Tendenza delle visite
Nessun dato sulla tendenza
Coinvolgimento
- Frequenza di rimbalzo--
- Pagine per visita--
- Durata media--
Fonti di traffico
Nessun dato sulle fonti
Paesi principali
Nessun dato sui paesi
Anteprima dell'interfaccia