Finanças
AI Competence
Ferramenta de análise de correlação de ações para estudar tendências de empresas.
Sobre esta ferramenta
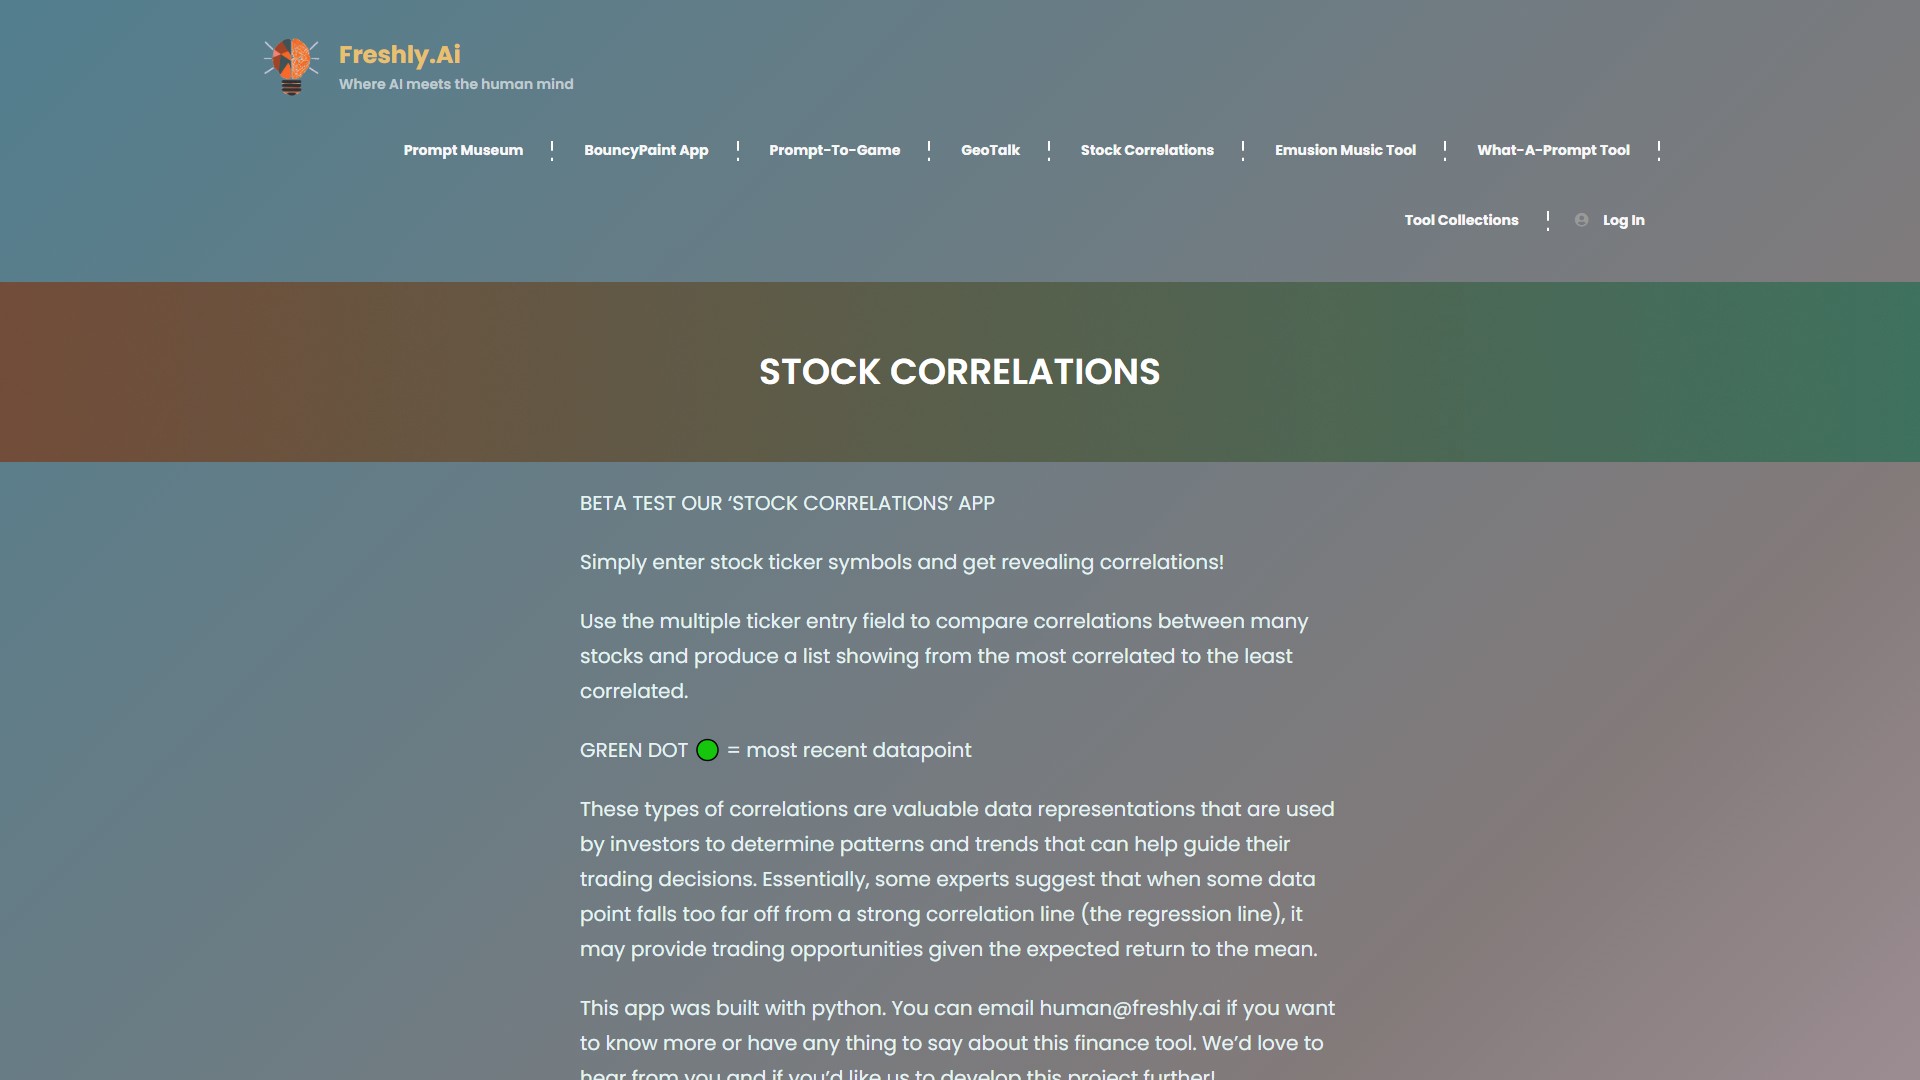
O AI Competence é uma ferramenta para analisar correlações entre ações. Insira vários símbolos de ações para comparar as correlações e obter uma lista da maior para a menor. O ponto verde indica o dado mais recente.
Essas correlações podem ajudar investidores a identificar padrões e tendências para orientar decisões de trading. Segundo alguns especialistas, um ponto de dados muito distante de uma linha de regressão pode indicar oportunidades baseadas no retorno esperado à média.
O aplicativo foi desenvolvido em Python. Para saber mais, envie um e-mail para human@freshly.ai. Destina-se a investidores e traders, está em fase beta e não apresenta informações de preços.
Análise de tráfego
Sinais de tráfego, classificação e engajamento desta ferramenta.
Tendência de visitas
Não há dados de tendência
Engajamento
- Taxa de rejeição--
- Páginas por visita--
- Duração média--
Fontes de tráfego
Não há dados de origem
Principais países
Não há dados por país
Prévia da interface