Tài chính
AI Competence
Công cụ phân tích tương quan cổ phiếu để nghiên cứu xu hướng doanh nghiệp.
Giới thiệu về công cụ này
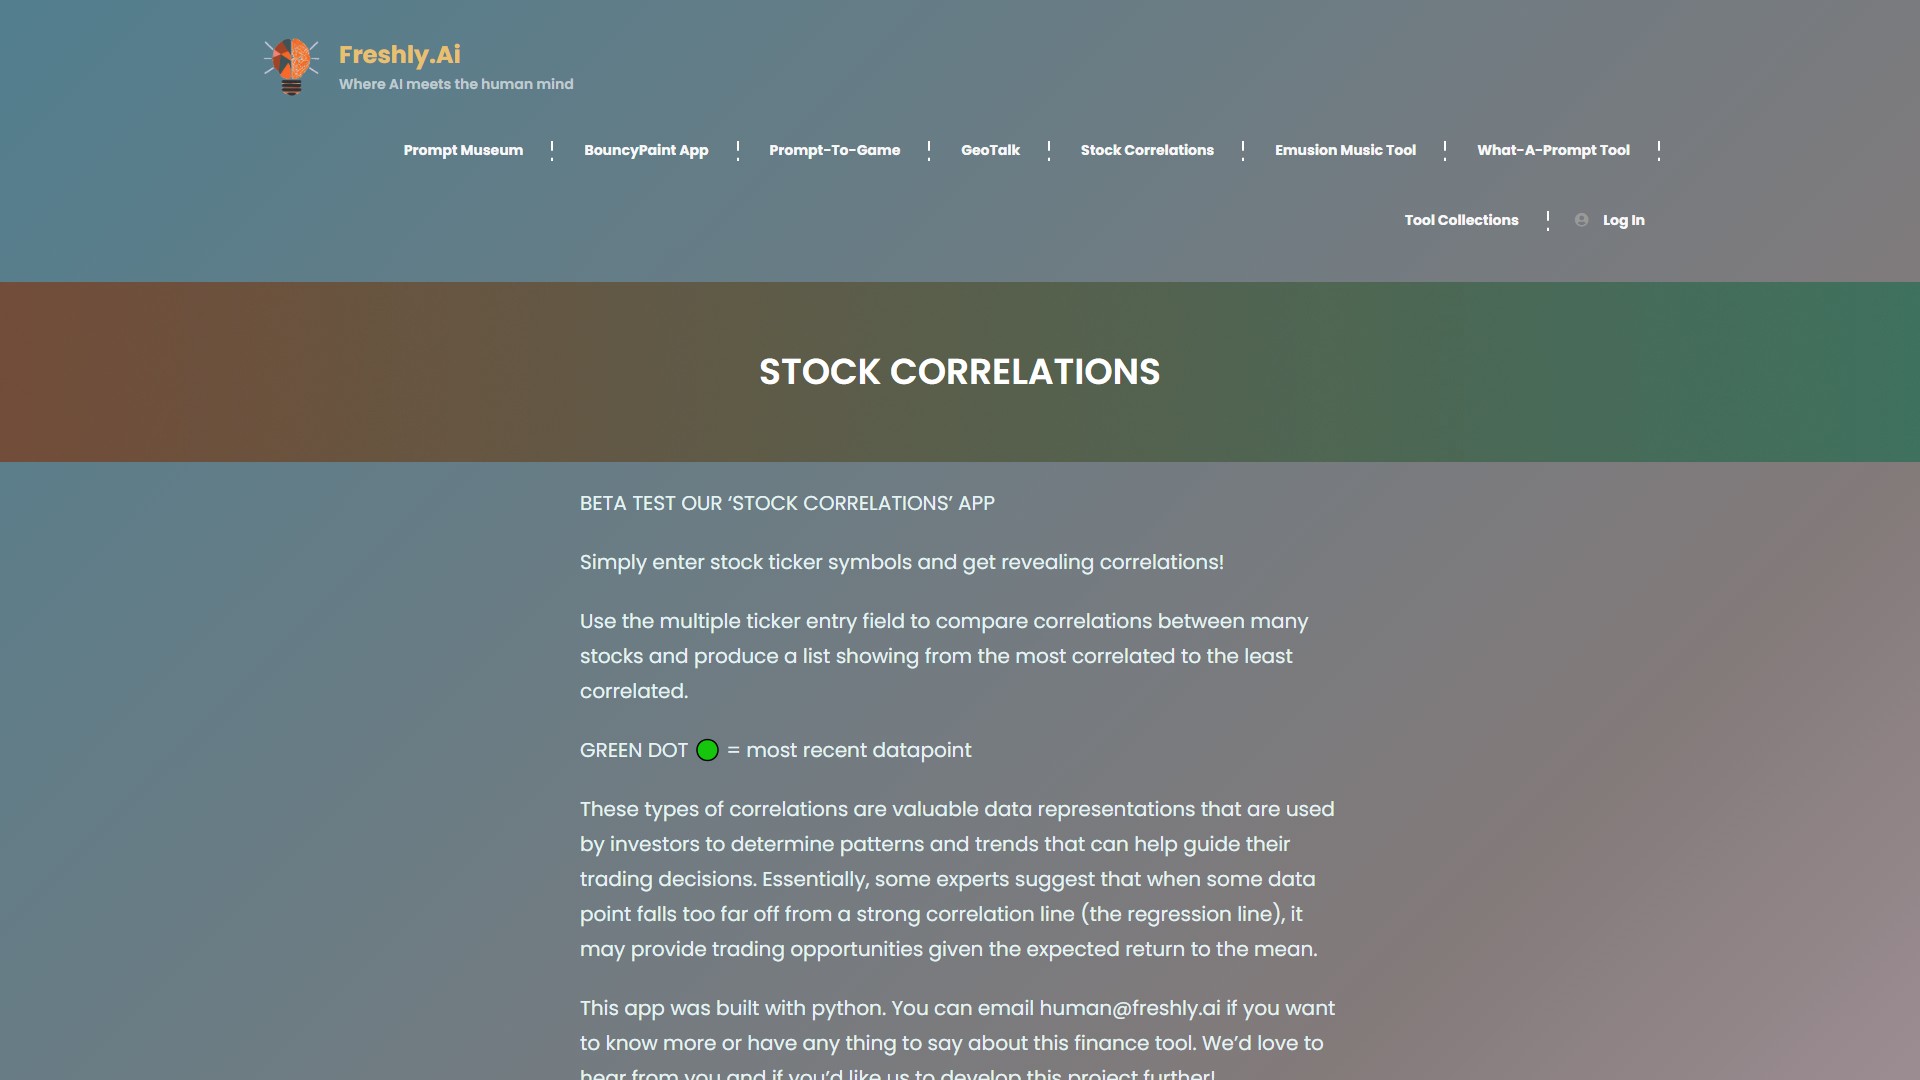
AI Competence là công cụ phân tích tương quan cổ phiếu. Nhập nhiều mã cổ phiếu để so sánh mức tương quan và xem danh sách từ tương quan cao nhất đến thấp nhất. Chấm màu xanh lá biểu thị điểm dữ liệu gần nhất.
Dữ liệu tương quan có thể giúp nhà đầu tư nhận diện mô hình và xu hướng để tham khảo khi đưa ra quyết định giao dịch. Theo một số chuyên gia, điểm dữ liệu lệch quá xa khỏi đường hồi quy có thể cho thấy cơ hội giao dịch dựa trên kỳ vọng giá trị trở về mức trung bình.
Ứng dụng được xây dựng bằng Python. Để biết thêm thông tin, hãy liên hệ human@freshly.ai. Công cụ dành cho nhà đầu tư và nhà giao dịch, hiện đang ở giai đoạn beta và không nêu thông tin giá.
Phân tích lưu lượng truy cập
Các chỉ số về lưu lượng truy cập, thứ hạng và mức độ tương tác của công cụ này.
Xu hướng lượt truy cập
Không có dữ liệu xu hướng
Mức độ tương tác
- Tỷ lệ thoát--
- Số trang mỗi lượt truy cập--
- Thời lượng trung bình--
Nguồn lưu lượng truy cập
Không có dữ liệu nguồn
Các quốc gia hàng đầu
Không có dữ liệu quốc gia
Bản xem trước giao diện