財務

AI Competence

A tool for value accruement report of companies insights.

Views 18.6K
Monthly visits 18.6K
Global rank ##2,558,087
Votes 0

About this tool

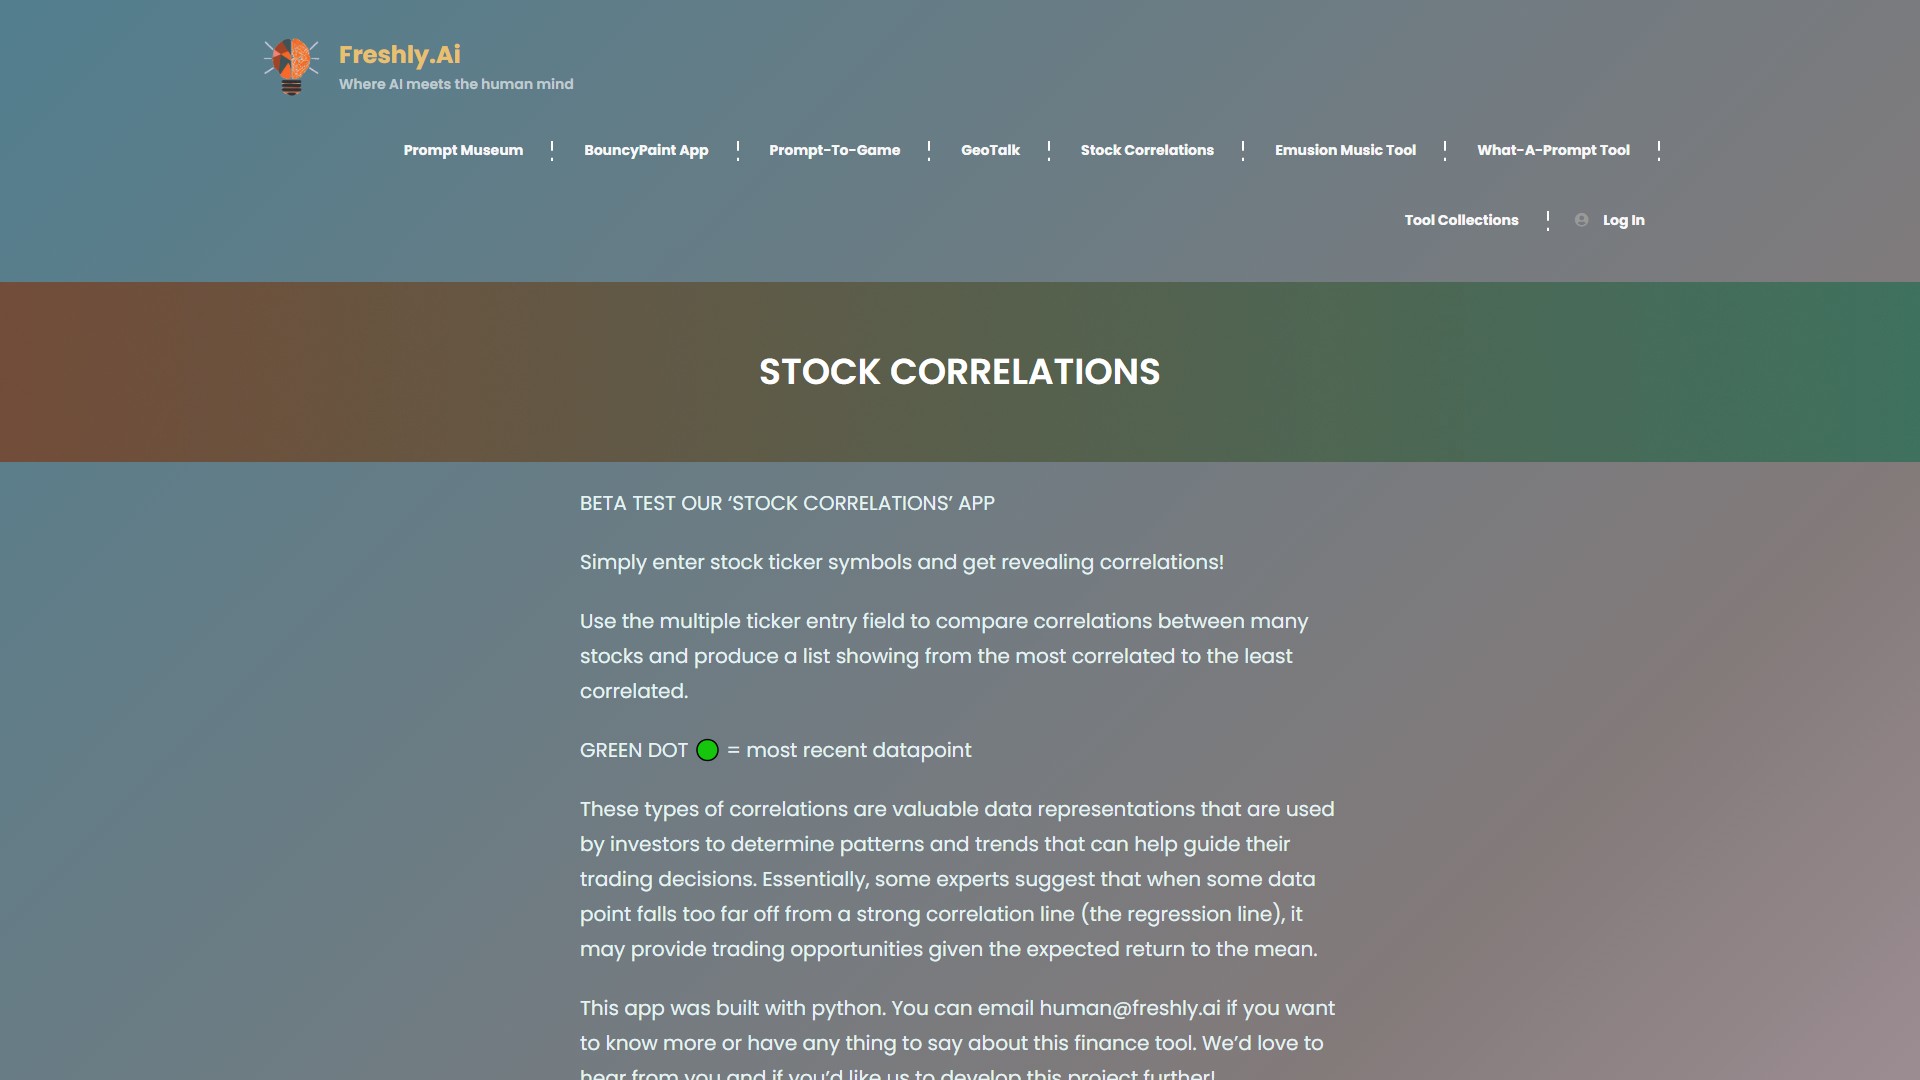
Main Features: Stock correlation analysis. Users can simply enter stock ticker symbols to compare correlations between many stocks and produce a list showing from the most correlated to the least correlated. The GREEN DOT (🟢) indicates the most recent datapoint.

Core Advantages & Value: These types of correlations are valuable data representations that are used by investors to determine patterns and trends that can help guide their trading decisions. Essentially, some experts suggest that when some data point falls too far off from a strong correlation line (the regression line), it may provide trading opportunities given the expected return to the mean.

Usage Instructions: Use the multiple ticker entry field to compare correlations between many stocks, and the system will produce a list showing from the most correlated to the least correlated.

Technical Details: This app was built with Python. Users can email human@freshly.ai if they want to know more or have anything to say about this finance tool.

Target Users: Investors and traders looking for stock price trends, patterns, and trading opportunities.

Pricing: The page does not mention any pricing information. The app is currently in the Beta testing stage, and users can access the app link directly to use it.

#Finance

Traffic analysis

Traffic, ranking, and engagement signals for this tool.

Global rank ##2,558,087
Country rank #208,968
Monthly visits 18.6K

Visit trend

No trend data

Engagement

  • Bounce rate--
  • Pages / visit--
  • Avg. duration--

Traffic sources

No source data

Top countries

No country data

Interface preview

User reviews