Financiën
AI Competence
Een tool voor rapporten over waardegroei en bedrijfsinzichten.
Over deze tool
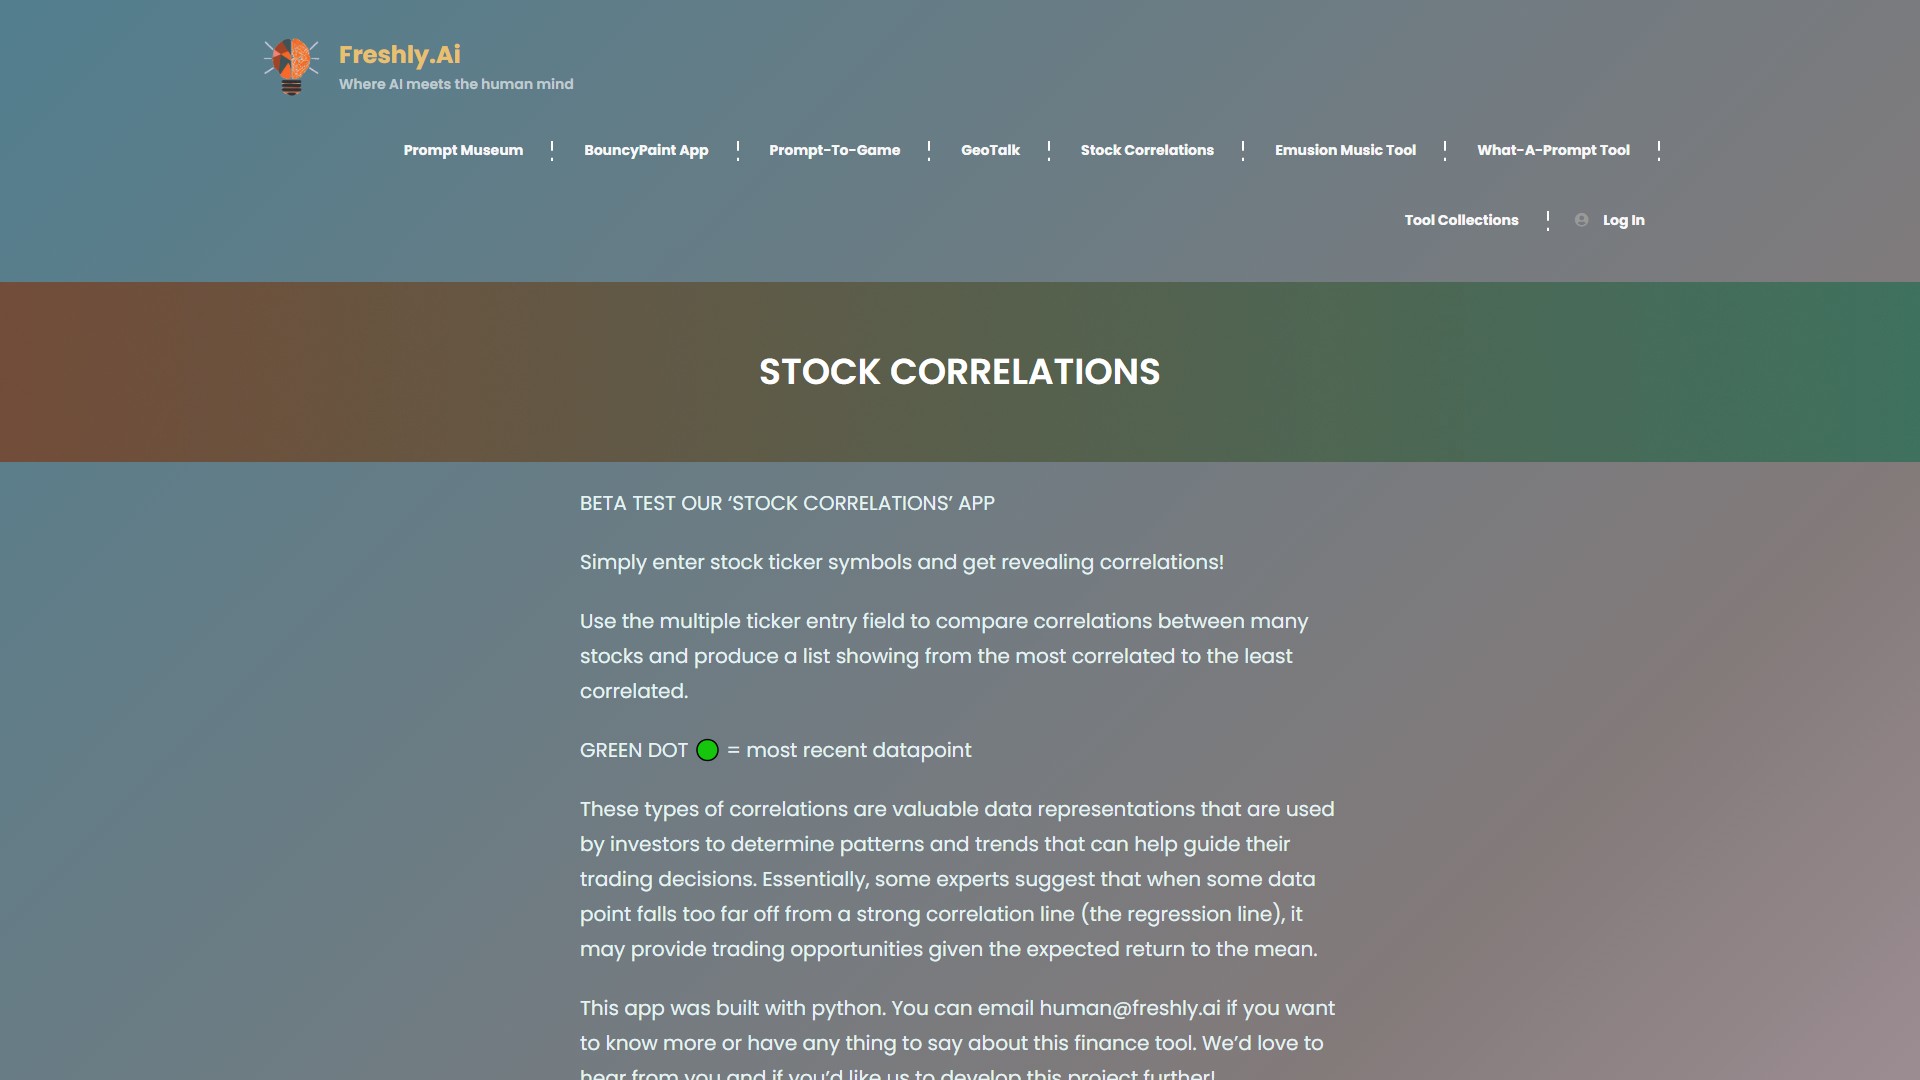
Belangrijkste functie: analyse van aandelen correlatie. Gebruikers kunnen eenvoudig tickers invoeren om correlaties tussen veel aandelen te vergelijken. De tool maakt een lijst van de sterkst tot de minst gecorreleerde aandelen. De groene stip (🟢) geeft het meest recente datapunt aan.
Belangrijkste voordelen en waarde: dergelijke correlaties zijn waardevolle gegevensweergaven die beleggers gebruiken om patronen en trends vast te stellen die hun handelsbeslissingen kunnen ondersteunen. Sommige experts stellen dat een datapunt dat te ver afwijkt van een sterke correlatielijn (de regressielijn) handelsmogelijkheden kan bieden, gezien het verwachte rendement naar het gemiddelde.
Gebruiksinstructies: gebruik het invoerveld voor meerdere tickers om correlaties tussen veel aandelen te vergelijken. Het systeem maakt een lijst van de sterkst tot de minst gecorreleerde aandelen.
Technische details: deze app is gebouwd met Python. Gebruikers kunnen een e-mail sturen naar human@freshly.ai voor meer informatie of feedback over deze financiële tool.
Doelgebruikers: beleggers en handelaren die zoeken naar trends, patronen en handelsmogelijkheden in aandelenkoersen.
Prijzen: de pagina vermeldt geen prijsinformatie. De app bevindt zich momenteel in de Beta-testfase en gebruikers kunnen de app rechtstreeks via de link openen.
Verkeersanalyse
Verkeers-, ranking- en betrokkenheidssignalen voor deze tool.
Bezoektrend
Geen trendgegevens
Betrokkenheid
- Bouncepercentage--
- Pagina's per bezoek--
- Gemiddelde duur--
Verkeersbronnen
Geen brongegevens
Belangrijkste landen
Geen landgegevens
Voorvertoning van de interface