Keuangan
AI Competence
Alat analisis korelasi saham untuk mempelajari tren perusahaan.
Tentang alat ini
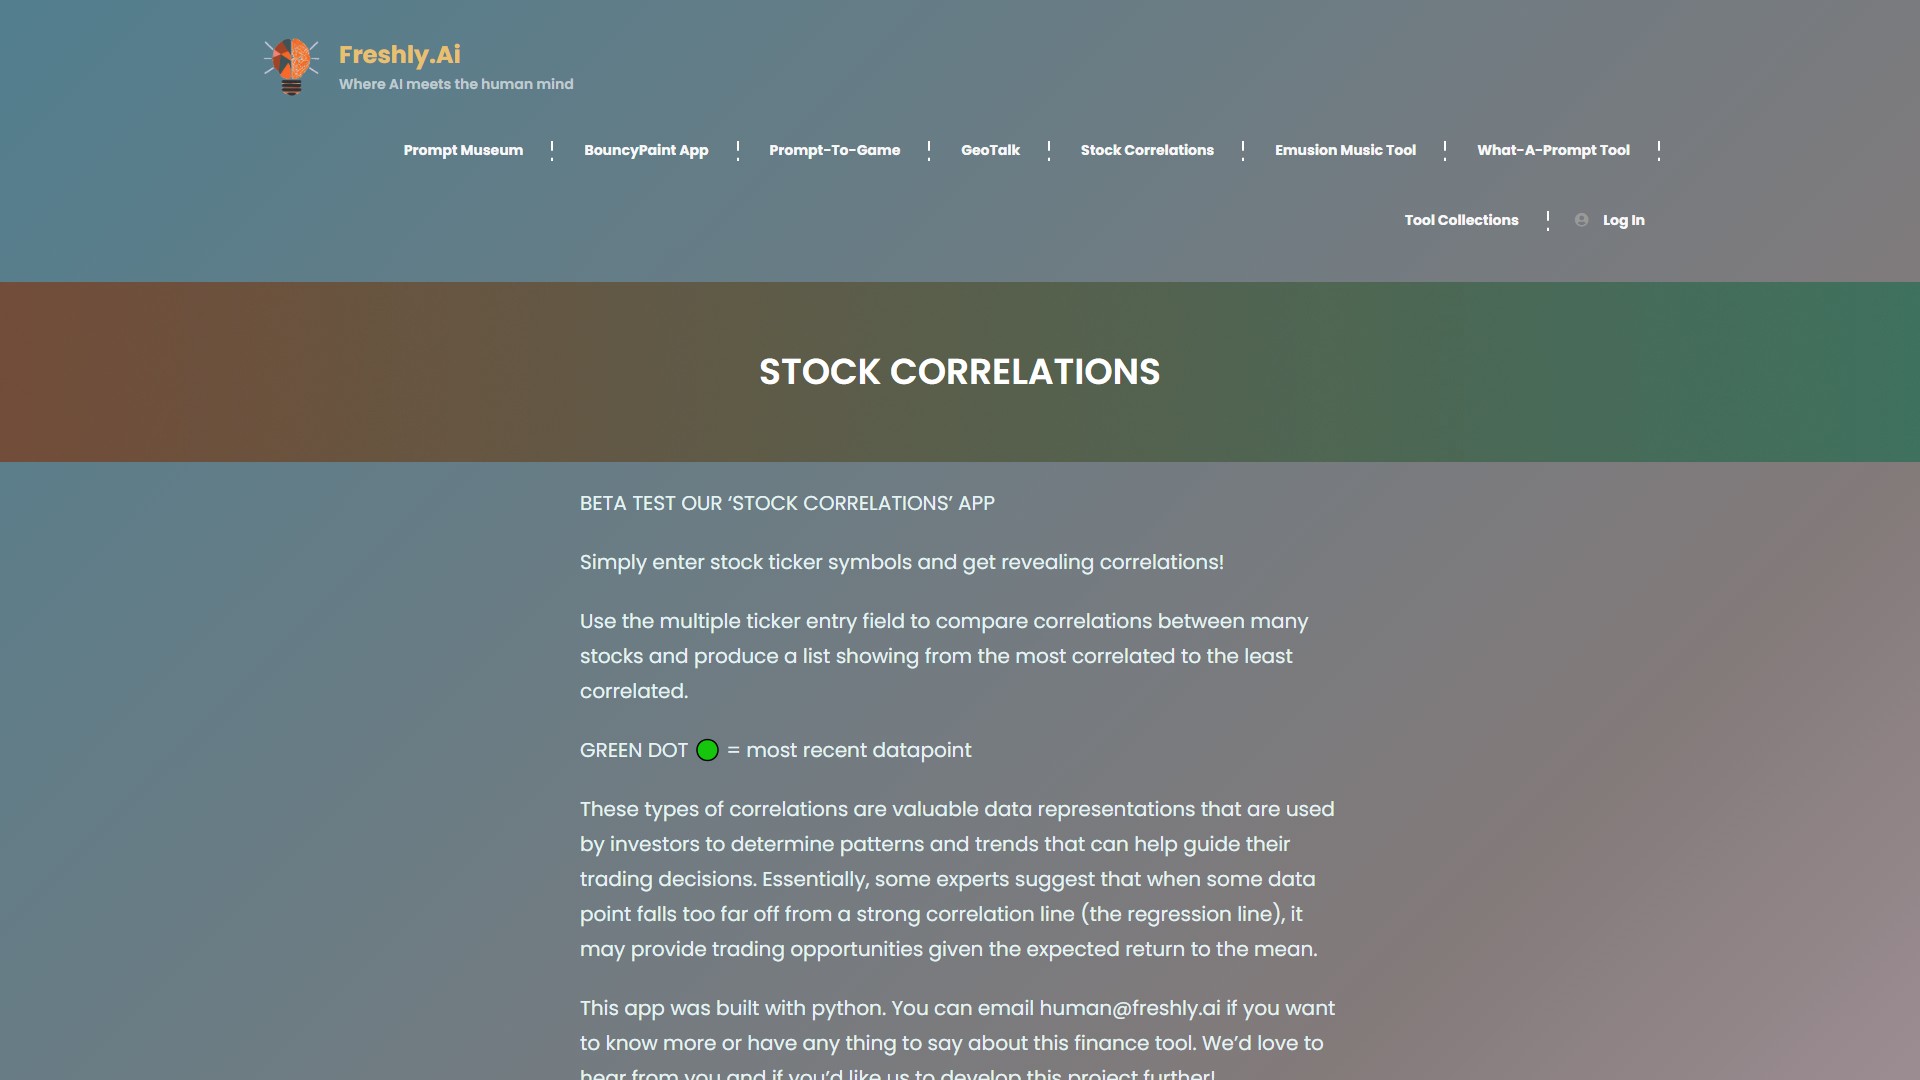
AI Competence adalah alat untuk menganalisis korelasi saham. Masukkan beberapa simbol ticker untuk membandingkan korelasi dan melihat daftar dari yang paling berkorelasi hingga yang paling rendah. Titik hijau menunjukkan titik data terbaru.
Data korelasi ini dapat membantu investor menemukan pola dan tren sebagai bahan pertimbangan keputusan trading. Menurut sebagian pakar, titik data yang menyimpang jauh dari garis regresi dapat menunjukkan peluang trading berdasarkan perkiraan kembalinya nilai ke rata-rata.
Aplikasi ini dibuat dengan Python. Untuk informasi lebih lanjut, hubungi human@freshly.ai. Alat ini ditujukan bagi investor dan trader, sedang dalam tahap beta, dan tidak mencantumkan informasi harga.
Analisis traffic
Sinyal lalu lintas, peringkat, dan interaksi untuk alat ini.
Tren kunjungan
Tidak ada data tren
Interaksi
- Rasio pentalan--
- Halaman per kunjungan--
- Durasi rata-rata--
Sumber traffic
Tidak ada data sumber
Negara teratas
Tidak ada data negara
Pratinjau antarmuka