Finanzas
AI Competence
Herramienta de análisis de correlaciones bursátiles para estudiar tendencias empresariales.
Acerca de esta herramienta
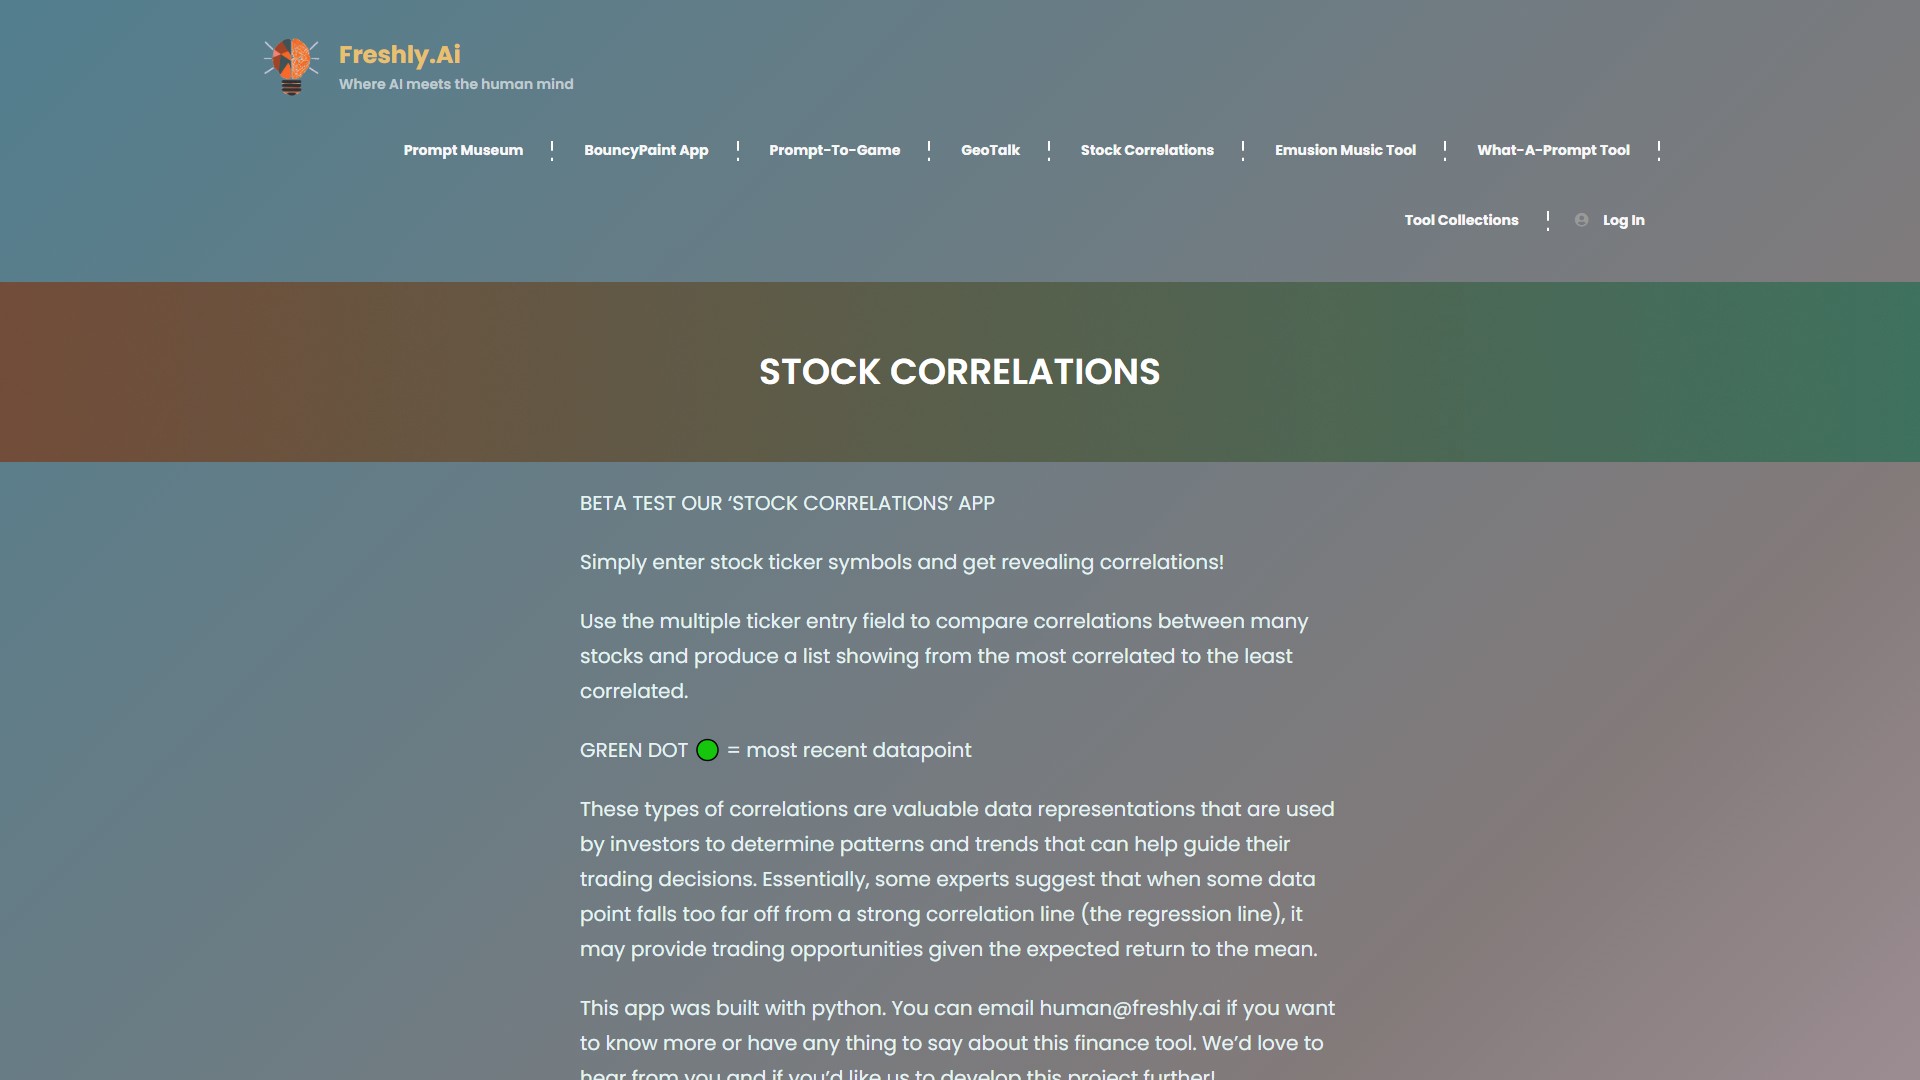
AI Competence es una herramienta para analizar correlaciones bursátiles. Introduce varios símbolos bursátiles para compararlos y obtener una lista ordenada desde la correlación más alta hasta la más baja. El punto verde indica el dato más reciente.
Estas correlaciones pueden ayudar a los inversores a identificar patrones y tendencias que orienten sus decisiones de trading. Según algunos expertos, una desviación importante de una línea de regresión puede indicar oportunidades basadas en el retorno esperado a la media.
La aplicación está desarrollada con Python. Para obtener más información, escribe a human@freshly.ai. Está dirigida a inversores y traders, se encuentra en fase beta y no muestra información sobre precios.
Análisis del tráfico
Señales de tráfico, clasificación y participación de esta herramienta.
Tendencia de visitas
No hay datos de tendencia
Interacción
- Tasa de rebote--
- Páginas por visita--
- Duración media--
Fuentes de tráfico
No hay datos de fuentes
Principales países
No hay datos por país
Vista previa de la interfaz