Chatbot AI
vizGPT
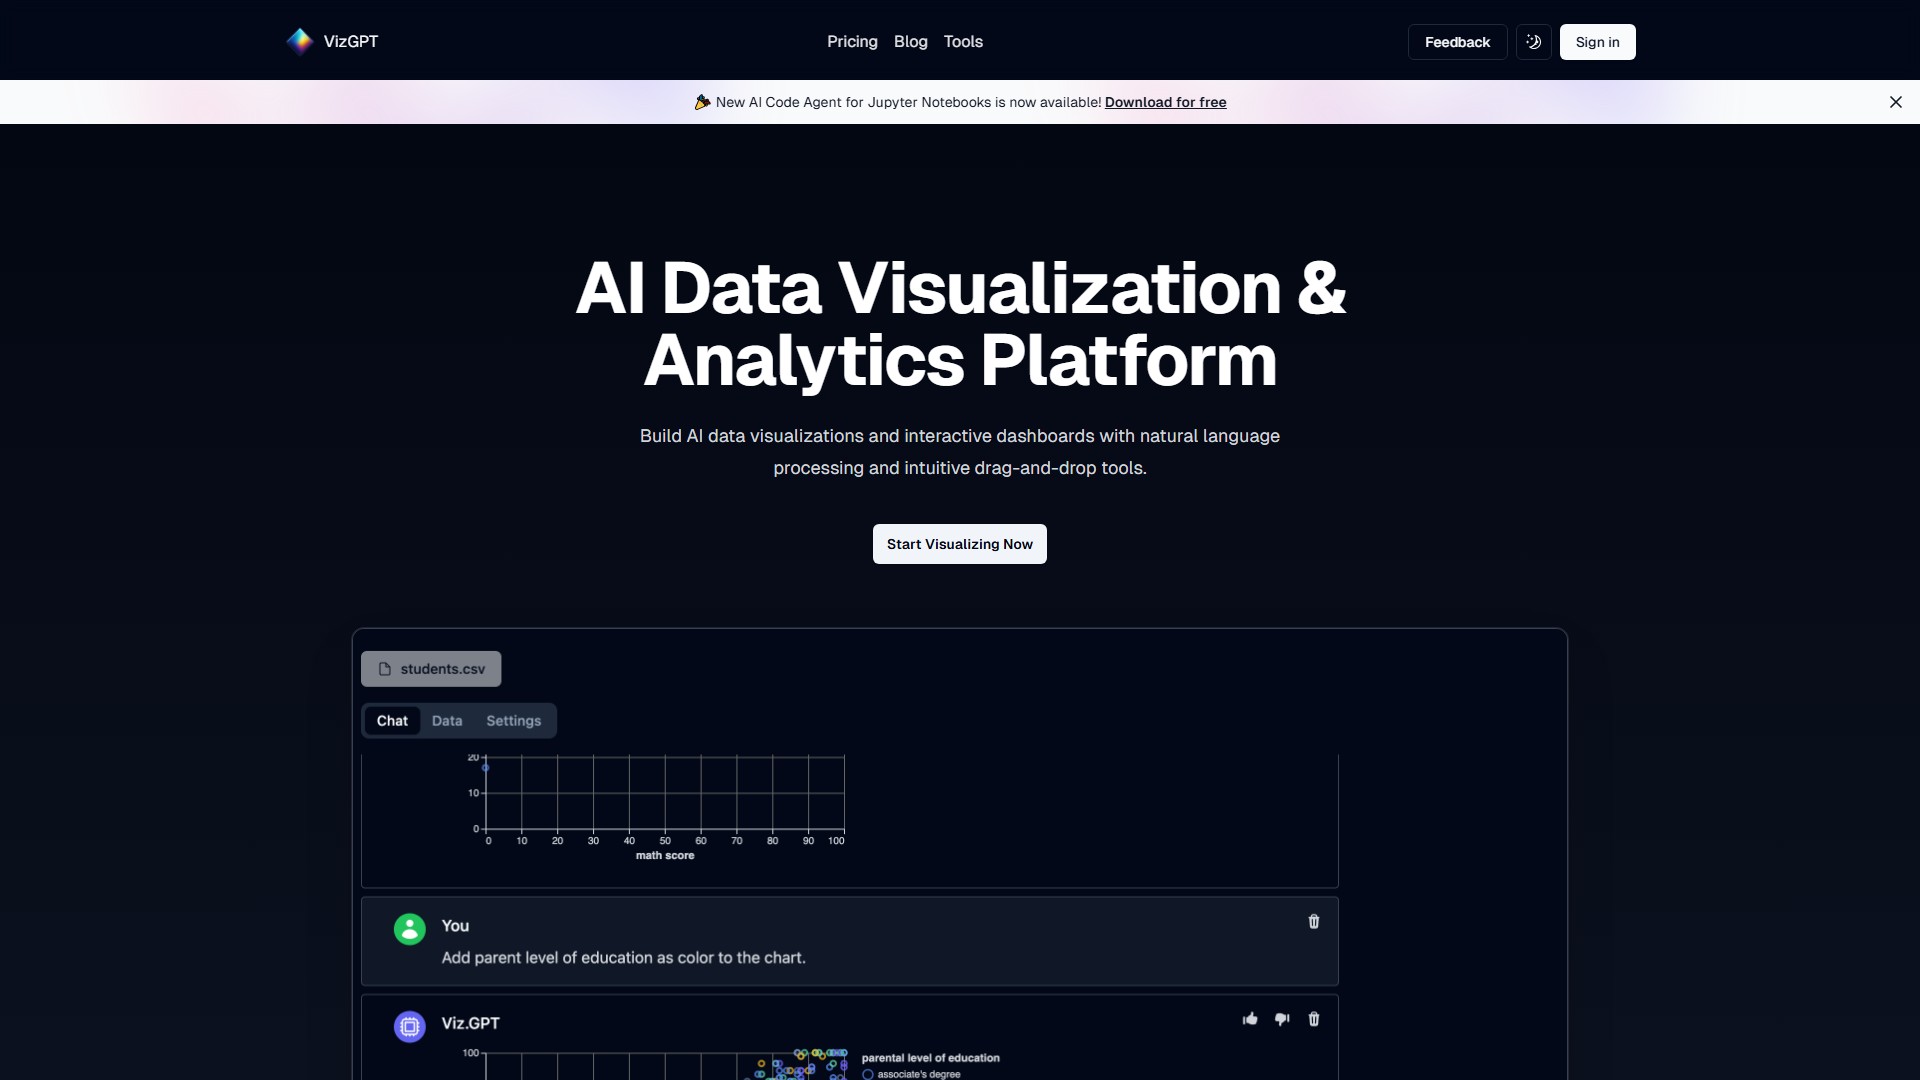
Sử dụng GPT để tạo biểu đồ trực quan từ các tập dữ liệu bằng ngôn ngữ tự nhiên. Bạn có thể chỉnh sửa biểu đồ theo từng bước trong ngữ cảnh để tăng độ chính xác mà không cần nhập lại truy vấn phức tạp.
Giới thiệu về công cụ này
Tính năng chính
- Trực quan hóa dữ liệu bằng ngôn ngữ tự nhiên: sử dụng NLP nâng cao để hiểu câu hỏi của người dùng, giúp phân tích dữ liệu dễ dàng như trò chuyện. Tạo nhanh các biểu đồ dữ liệu và bảng điều khiển phân tích bằng AI mà không cần viết mã hay lo lỗi cú pháp.
- GUI không cần mã với thao tác kéo thả: cung cấp cả giao diện kéo thả trực quan và giao diện ngôn ngữ tự nhiên để tạo biểu đồ dữ liệu bằng AI.
- Bảng dữ liệu thông minh mạnh mẽ: cung cấp các bảng dữ liệu AI dễ sử dụng để chuyển đổi, lập hồ sơ và chuẩn bị dữ liệu cho việc trực quan hóa.
- Phân tích cộng tác: mời đồng đội bình luận trên biểu đồ, cùng xây dựng bảng điều khiển và biến dữ liệu thành những câu chuyện thúc đẩy hành động.
Đặc điểm chính
- Hiểu ngữ cảnh trực quan: vizGPT hiểu ngữ cảnh của việc trực quan hóa và phân tích dữ liệu bằng AI, từ đó cung cấp biểu đồ và thông tin chi tiết chính xác.
- Phản hồi theo thời gian thực: đặt câu hỏi và nhận biểu đồ trực quan ngay lập tức.
- Ghi nhớ ngữ cảnh: AI ghi nhớ các truy vấn trước đó, cho phép tiếp tục từ nơi đã dừng và duy trì mạch phân tích nhất quán.
Đối tượng sử dụng
Nhà phân tích dữ liệu, thành viên nhóm kinh doanh, các nhóm cần nhanh chóng rút ra thông tin chi tiết từ dữ liệu và xây dựng câu chuyện dữ liệu, cũng như người dùng muốn giảm rào cản kỹ thuật khi trực quan hóa dữ liệu.
Ưu điểm cốt lõi
Sự kết hợp giữa AI hội thoại và thao tác kéo thả trực quan giúp giảm đáng kể rào cản đối với việc phân tích và trực quan hóa dữ liệu. Khả năng ghi nhớ ngữ cảnh duy trì sự nhất quán cho các phiên phân tích nhiều lượt, còn các tính năng chuẩn bị dữ liệu và cộng tác cho phép đội ngũ tập trung vào thông tin chi tiết thay vì công việc lặp lại.
Quy trình sử dụng
- Đăng nhập và truy cập không gian làm việc.
- Đặt câu hỏi bằng ngôn ngữ tự nhiên hoặc dùng giao diện kéo thả để thao tác với bảng dữ liệu.
- AI tạo biểu đồ và thông tin trực quan theo thời gian thực.
- Sử dụng khả năng ghi nhớ ngữ cảnh để phân tích liên tục và chuyên sâu.
- Mời thành viên nhóm bình luận và cùng xây dựng bảng điều khiển, biến dữ liệu thành câu chuyện.
Thông tin giá
Nền tảng cung cấp bản dùng thử miễn phí (“Try it free today”). Để xem mức giá cụ thể, bạn cần truy cập trang Pricing.
Phân tích lưu lượng truy cập
Các chỉ số về lưu lượng truy cập, thứ hạng và mức độ tương tác của công cụ này.
Xu hướng lượt truy cập
Không có dữ liệu xu hướng
Mức độ tương tác
- Tỷ lệ thoát--
- Số trang mỗi lượt truy cập--
- Thời lượng trung bình--
Nguồn lưu lượng truy cập
Không có dữ liệu nguồn
Các quốc gia hàng đầu
Không có dữ liệu quốc gia
Bản xem trước giao diện