Chatbots de AI
vizGPT
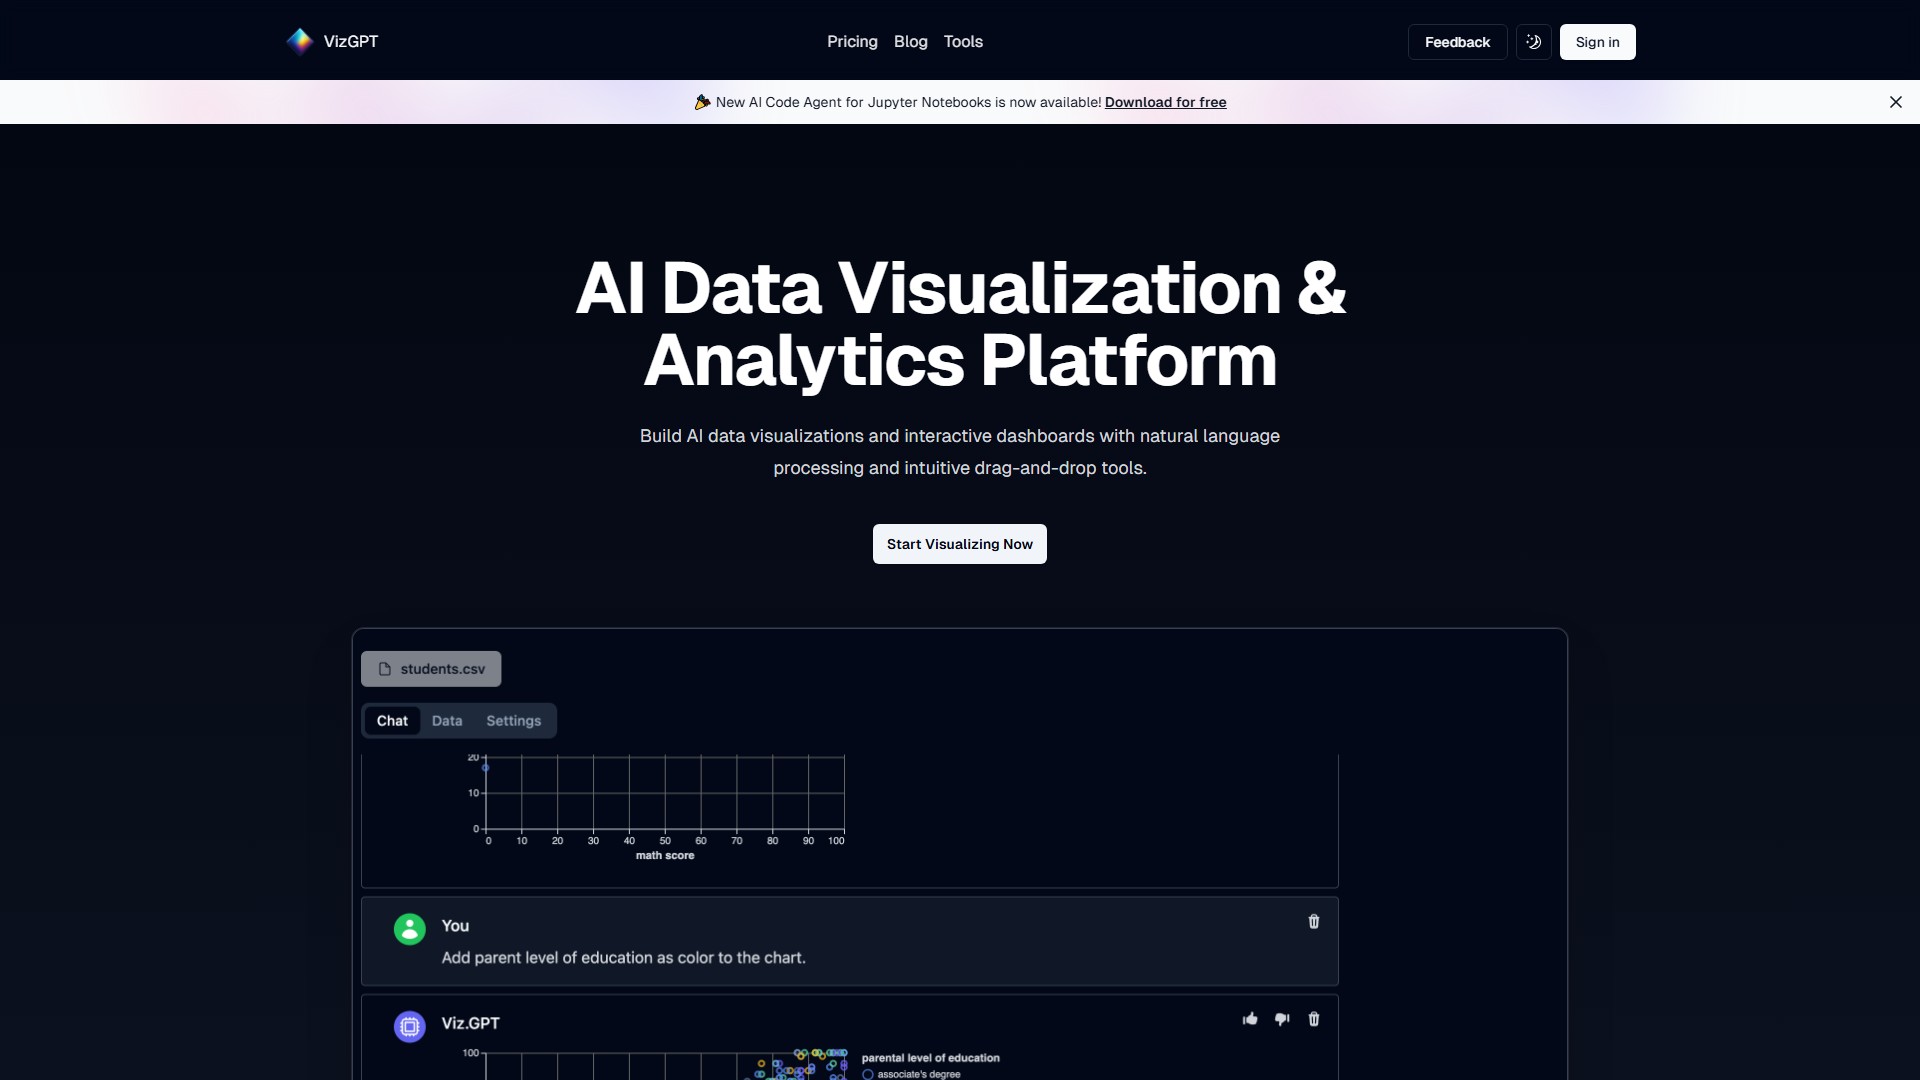
Usa GPT para generar visualizaciones a partir de conjuntos de datos mediante lenguaje natural. Puedes editar la visualización paso a paso según el contexto para hacerla más precisa sin volver a escribir la consulta compleja.
Acerca de esta herramienta
Funciones principales
- Visualización de datos en lenguaje natural: utiliza procesamiento avanzado del lenguaje natural para comprender las preguntas y facilitar el análisis de datos como si fuera una conversación. Genera rápidamente visualizaciones de datos y paneles analíticos con IA sin escribir código ni preocuparte por errores de sintaxis.
- Interfaz gráfica sin código con arrastrar y soltar: ofrece una interfaz intuitiva de arrastrar y soltar y otra de lenguaje natural para crear visualizaciones de datos con IA.
- Potente tabla de datos inteligente: proporciona tablas de datos con IA fáciles de usar para transformar, perfilar y preparar datos para la visualización.
- Análisis colaborativo: invita a tus compañeros a comentar gráficos, crear paneles juntos y convertir los datos en narrativas que inspiren acciones.
Características clave
- Comprensión visual y contextual: vizGPT entiende el contexto de la visualización y el análisis de datos impulsados por IA, y ofrece gráficos e información precisos.
- Respuestas en tiempo real: haz una pregunta y obtén una visualización al instante.
- Memoria contextual: la IA recuerda las consultas anteriores para continuar desde donde lo dejaste y mantener una narrativa de análisis coherente.
Usuarios objetivo
Está dirigido a analistas de datos, miembros de equipos empresariales, equipos que necesitan extraer rápidamente información de los datos y crear narrativas de datos, y usuarios que desean reducir la barrera técnica de la visualización de datos.
Ventajas principales
La combinación de IA conversacional y operaciones visuales de arrastrar y soltar reduce considerablemente la barrera de entrada al análisis y la visualización de datos. La memoria contextual mantiene la coherencia en análisis de varios turnos, mientras que las funciones de preparación de datos y colaboración permiten centrarse en la información y no en las tareas repetitivas.
Flujo de uso
- Inicia sesión y accede al espacio de trabajo.
- Haz preguntas en lenguaje natural o usa la interfaz de arrastrar y soltar para manipular las tablas de datos.
- La IA genera gráficos e información visual en tiempo real.
- Utiliza la memoria contextual para realizar un análisis continuo y profundo.
- Invita a los miembros del equipo a comentar y crear paneles juntos para convertir los datos en historias.
Información de precios
La plataforma ofrece una prueba gratuita («Try it free today»). Para consultar los precios específicos, debes visitar su página Pricing.
Análisis del tráfico
Señales de tráfico, clasificación y participación de esta herramienta.
Tendencia de visitas
No hay datos de tendencia
Interacción
- Tasa de rebote--
- Páginas por visita--
- Duración media--
Fuentes de tráfico
No hay datos de fuentes
Principales países
No hay datos por país
Vista previa de la interfaz