Chatbots de AI
vizGPT
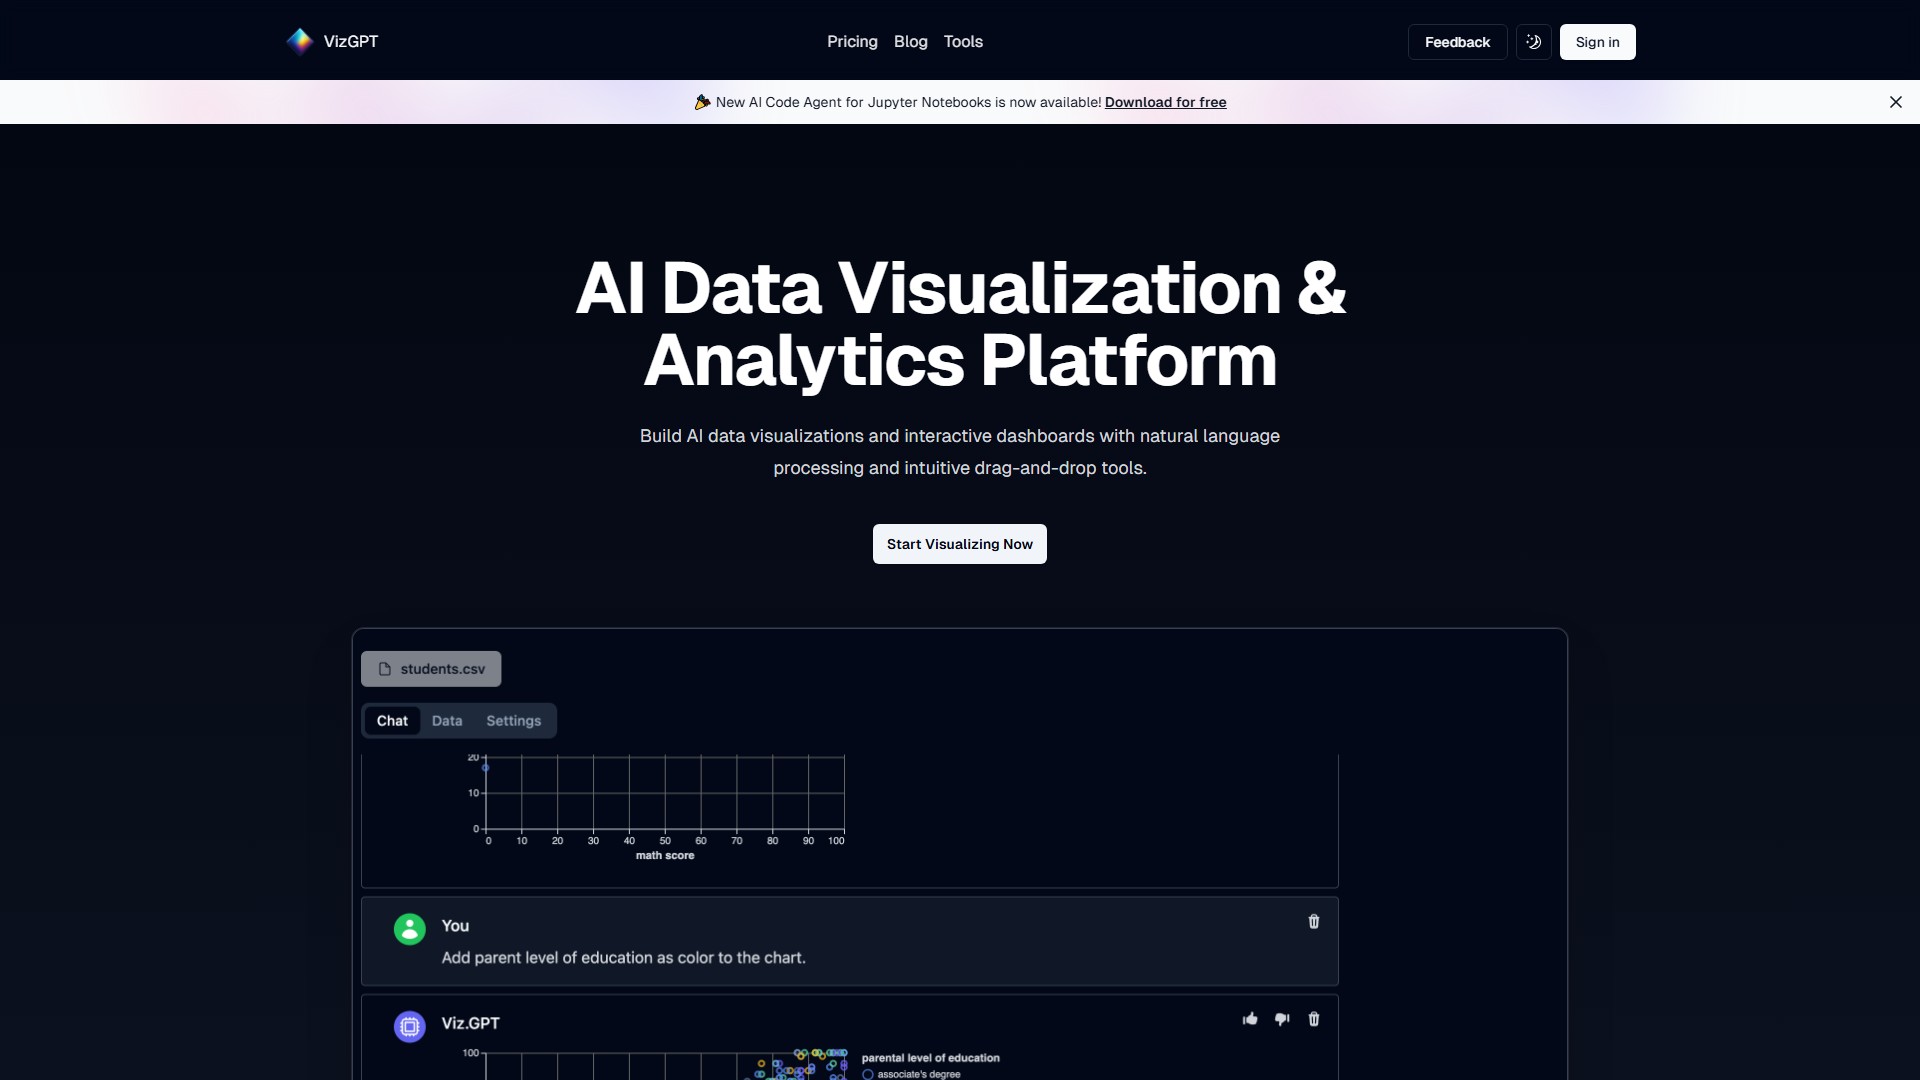
Use o GPT para gerar visualizações a partir de conjuntos de dados com linguagem natural. Edite a visualização passo a passo no contexto para torná-la mais precisa, sem redigitar a consulta complexa.
Sobre esta ferramenta
Principais recursos
- Visualização de dados em linguagem natural: usa processamento avançado de linguagem natural para entender as perguntas dos usuários, tornando a análise de dados tão simples quanto uma conversa. Gere rapidamente visualizações de dados e dashboards analíticos com IA sem escrever código nem se preocupar com erros de sintaxe.
- GUI sem código com arrastar e soltar: oferece uma interface intuitiva de arrastar e soltar e uma interface de linguagem natural para criar visualizações de dados com IA.
- Tabela de dados inteligente e poderosa: oferece tabelas de dados com IA fáceis de usar para transformar, criar perfis e preparar dados para a visualização.
- Análise colaborativa: convide colegas para comentar gráficos, criar dashboards em conjunto e transformar dados em narrativas que incentivem ações.
Principais características
- Compreensão visual contextual: o vizGPT entende o contexto da visualização e da análise de dados orientadas por IA, fornecendo gráficos e insights precisos.
- Respostas em tempo real: faça uma pergunta e obtenha uma visualização instantaneamente.
- Memória contextual: a IA lembra consultas anteriores, permitindo retomar o trabalho de onde parou e manter uma narrativa de análise coerente.
Usuários-alvo
Analistas de dados, integrantes de equipes de negócios, equipes que precisam extrair insights rapidamente dos dados e criar narrativas de dados, além de usuários que querem reduzir a barreira técnica da visualização de dados.
Principais vantagens
A combinação de IA conversacional com operações visuais de arrastar e soltar reduz significativamente a barreira para a análise e a visualização de dados. A memória contextual mantém a coerência em análises com várias interações, enquanto os recursos de preparação de dados e colaboração permitem que as equipes se concentrem nos insights, e não no trabalho repetitivo.
Fluxo de uso
- Faça login e acesse o workspace.
- Faça perguntas em linguagem natural ou use a interface de arrastar e soltar para manipular tabelas de dados.
- A IA gera gráficos e insights visuais em tempo real.
- Use a memória contextual para uma análise contínua e aprofundada.
- Convide membros da equipe para comentar e criar dashboards em conjunto, transformando dados em histórias.
Informações de preços
A plataforma oferece um teste grátis (“Try it free today”). Para consultar os preços específicos, é necessário visitar a página Pricing.
Análise de tráfego
Sinais de tráfego, classificação e engajamento desta ferramenta.
Tendência de visitas
Não há dados de tendência
Engajamento
- Taxa de rejeição--
- Páginas por visita--
- Duração média--
Fontes de tráfego
Não há dados de origem
Principais países
Não há dados por país
Prévia da interface