Summarizer
MyMap.AI Research Paper Summarizer
Main features: upload research papers or PDFs to generate clear summaries; process URLs via AI; modify AI-generated summaries for customization; export summaries as PDFs or share via unique URLs. Key features: AI-native technology, no manual effort required; support for multiple file formats; integrated web search fetching latest info from Google and Bing; internet access to extract key info from URLs; real-time team collaboration; share and export capabilities. Target users: researchers, students, educators, and industry professionals. Core advantages: efficient and accurate, saving reading time; customizable summary depth; real-time collaboration support; easy sharing and exporting. Typical use cases: researchers accelerating literature reviews to quickly identify key findings and methodologies; students enhancing exam preparation by creating focused study materials; professionals staying updated in their field by efficiently tracking new developments and applying cutting-edge knowledge. Pricing: free with daily summary limits; paid subscription plans for unlimited access.
About this tool
Main Features:
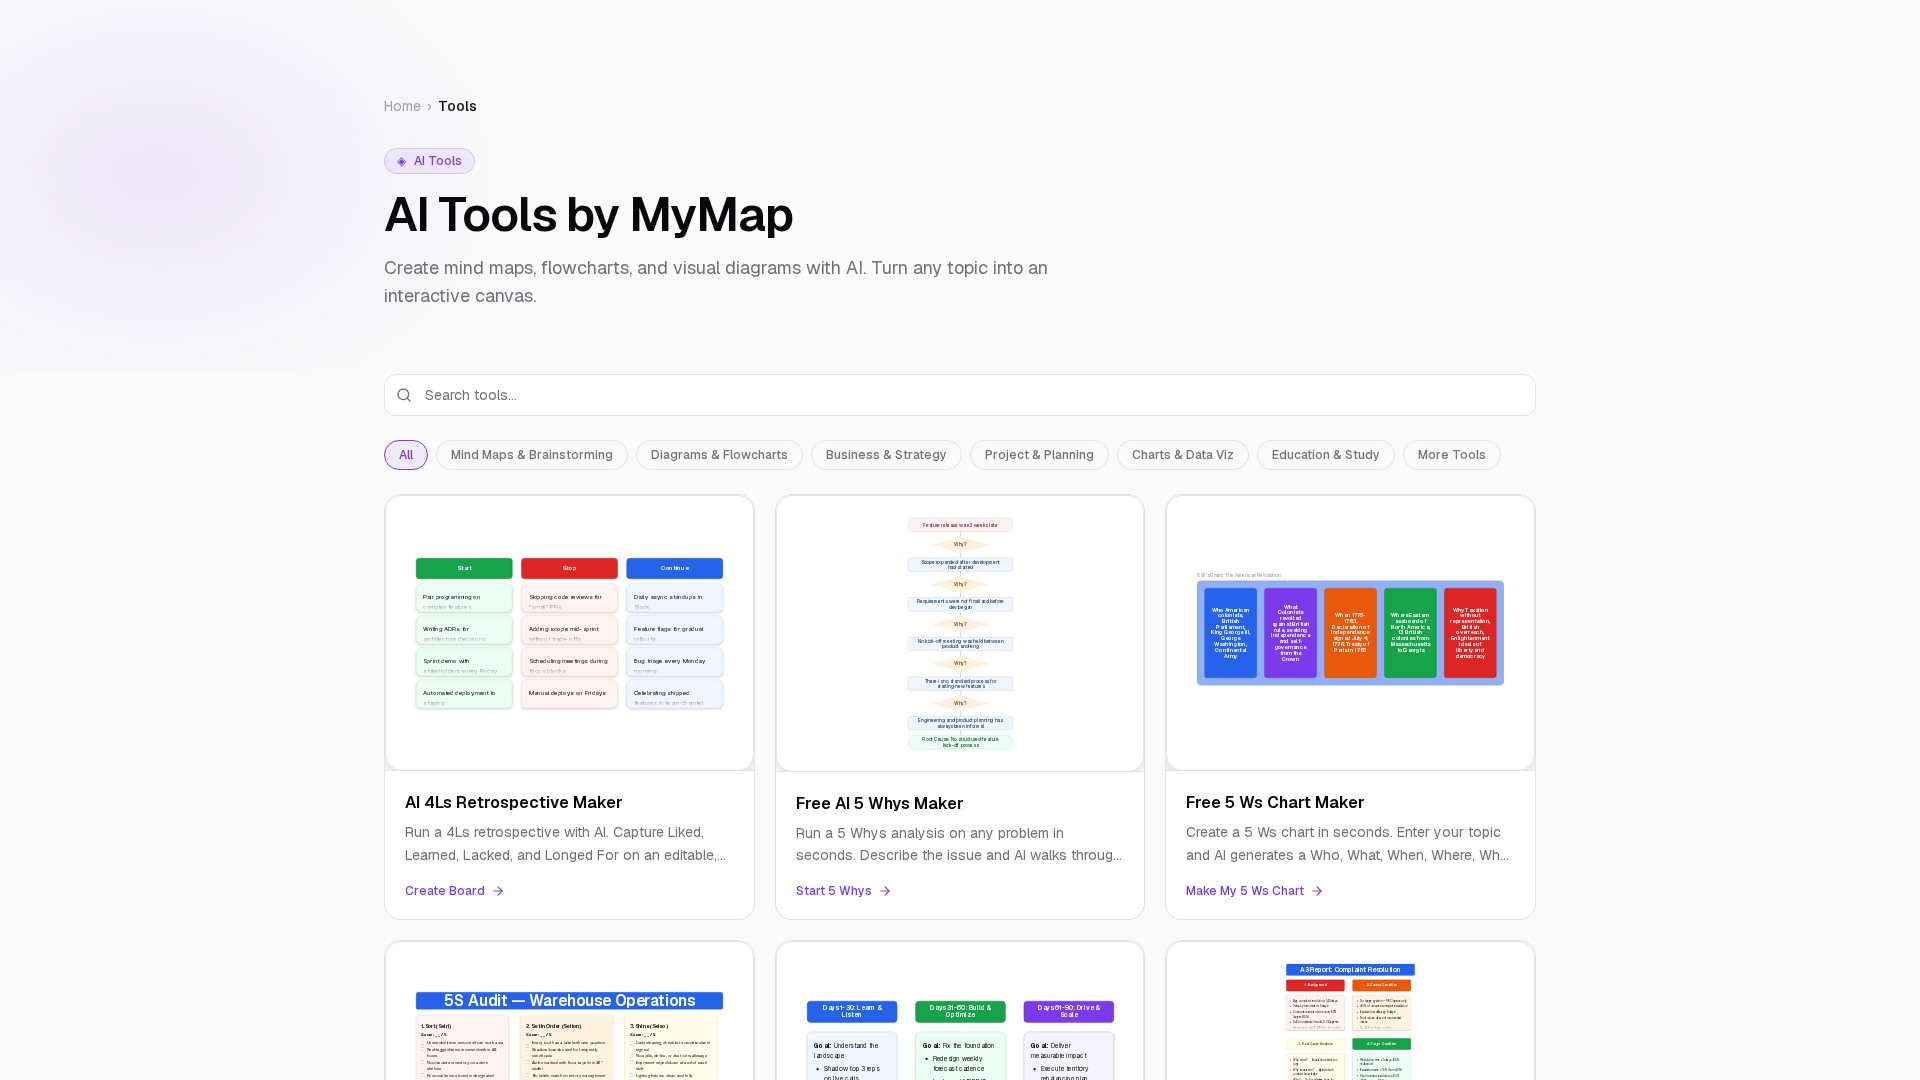
- Extensive AI diagram generators: Supports mind maps, flowcharts, architecture diagrams, affinity diagrams, whiteboards, Ansoff matrix, A3 reports, 5Ws charts, 5 Whys analysis, 5S audit templates, 90-day plans, action plans, anatomy diagrams, atomic structure diagrams, animal cell diagrams, anchor charts, etc.
- AI presentations & study tools: AI PowerPoint generator, AI slides generator, AI flashcards maker, AI quiz maker, AI study guide generator.
- AI summarization & content extraction: Article summarizer, audio summarizer, abstract generator, academic answer generator.
- Custom generation: Users can describe an idea from scratch, and AI generates a custom map from scratch.
Key Characteristics:
- AI-driven instant generation: Enter a topic or description, and AI creates a structured visual diagram with decision nodes, branches, and connections in seconds. AI canvas tools win when they show results instantly — users should see a finished board within 5 seconds of typing their first idea.
- Interactive infinite canvas: Generated charts are on an editable, shareable canvas. Supports interactive editing like selecting nodes, moving nodes with arrow keys, removing nodes or edges, and canceling actions.
- Deep structured output: Provides phased plans with timelines, owners, and deliverables (e.g., 30/60/90 day plans), and Toyota-style A3 reports with background, analysis, countermeasures, and follow-up.
- Multi-modal & template support: Offers ready-made templates categorized for Business & Strategy, Project & Planning, Charts & Data Viz, Education & Study, and more.
Target Users:
- Product managers, design teams, educators, solo founders, sales teams (B2B account mapping), students, and researchers.
- Professional teams requiring agile retrospectives, root cause analysis, architecture decisions, sales territory planning, and sprint demos.
Core Advantages:
- Instant Visualization: Instantly transforms complex text or concepts into intuitive visual presentations — signal over noise.
- Structured & Actionable: Generates not just graphics, but also scoring criteria (e.g., 5S audit), milestones, success metrics (e.g., 90-day plan), and implementation steps.
- Seamless Interaction: Supports keyboard shortcuts (Enter/Space to select, arrow keys to move, Delete to remove, Escape to cancel) for efficient editing.
Typical Use Cases & Workflows:
- Business Strategy: Use Ansoff Matrix for growth strategy (Market Penetration, Market Development, Product Development, Diversification); map AARRR funnel for growth; create 4Ls retrospective board capturing Liked, Learned, Lacked, Longed For.
- Problem Solving: Use 5 Whys analysis to walk through five layers of 'why', building a causal chain that surfaces the root cause; use A3 report template to document background, current condition, target condition, countermeasures, and follow-up.
- Project Planning: Generate an action plan with phases for research, content creation, launch, and measurement; create a 30/60/90 day plan with milestones for sales managers.
- System Architecture: Generate architecture diagrams featuring web clients, CDN, load balancers, API gateways, microservices, databases, and caches.
- Education & Study: Turn articles into flashcards or quizzes; generate anchor charts for photosynthesis, anatomy diagrams, or atomic structure diagrams.
Pricing Model:
- Operates on a Freemium model. Many tools are explicitly labeled as Free. The page includes a 'Pricing' section indicating premium subscription tiers are available for advanced features.
Traffic analysis
Traffic, ranking, and engagement signals for this tool.
No analytics data yet
Interface preview