xyzt.ai

Core Features:
- Spatial and temporal analytics: Perform intuitive and easy analytics on any spatio-temporal data (locations, timestamps, and attributes).
- Big Data Visual Analytics Engine: Built on a novel architecture that scales to billions of location records while maintaining interactivity.
- Split View Analysis: Navigate and look for unique insights using two maps and two timelines. Synchronize maps to look for differences in time, or dedicate different locations to each view to compare and analyze change.
- From Data To Insights: Extract insights using dedicated location analytics pages, including trend analytics, time-of-day/hour-of-day, segmentation, origin-destination, and dwell and travel time analytics.
- Tell a story with your data: Create and communicate stories by building informative and beautiful dashboards combining multiple widgets including interactive maps, timelines, bar charts, and more.
- Collaborate, Share, and Embed: Work with colleagues on the same projects, share visualizations and analysis straight from the platform via links, or embed interactive maps, charts, and dashboards in your own web pages or blog posts.
- Run on Any Device: Handle data with the same interactivity whether working from a desktop or on-the-go on a mobile device (capable of handling 1.5 billion location records on a smartphone).
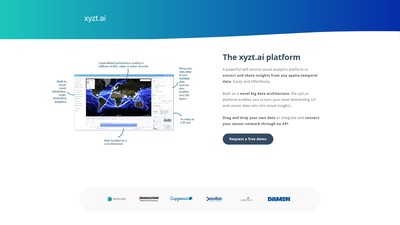
- Integrate and bring instant analytics to your customers: Drag and drop your own data or connect sensor networks through an API. Integrate visualizations and analytics into your own solution using an OpenAPI compliant REST API and by sharing or embedding visuals to monetize data.
Core Benefits:
- Get started in less than a day adding location analytics to your solution.
- Handle the entire chain from data ingestion to insight generation and reporting – instantly and effortlessly.
- Leverage built-in industry specific analysis, visualization, and reporting.
- Detect anomalies, find similarities, and anticipate future events.
- Finally look at your entire data set no matter the size.
- Enjoy an interactive User Experience (UX): instantly, effortlessly, and beautiful.
- Don’t worry about implementation, operations, and maintenance; the subscription-based SaaS model has you covered.
Usage Workflow: Drag and drop data or ingest via REST API -> Perform spatial-temporal analytics and split view comparisons -> Extract insights like trends and OD -> Build visual dashboards -> Share links or embed in websites/mobile -> (Optional) Integrate into own products via API for monetization.
Target Users: IoT and sensor network operators, mobility and traffic data analysts, maritime and ports industry professionals, big data analysts handling large-scale location records, enterprises needing to integrate spatio-temporal analytics into their own solutions.
Pricing Model: Subscription-based SaaS model. The page offers a "Request a free demo" option to schedule a live demo with experts. Specific pricing requires contacting the company.
의론